Overview
The Data Grid component is designed to provide users with a clear way to interact with data from the existing visualization based on a specific data view. This component serves as a read-only data presentation interface, allowing users to access information without the ability to make modifications.
Users have the option to freeze columns, making it easy to keep important information in view as they scroll horizontally through large datasets. Data can be sorted in ascending or descending order with just a click, allowing users to organize information for their specific needs. Robust filtering options enable users to refine their data view, displaying only the records that meet their criteria. This enhances efficiency and makes it easier to locate specific information within a dataset.
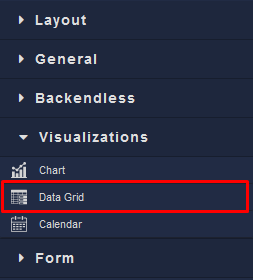
Locating the Data Grid component in the toolbar:

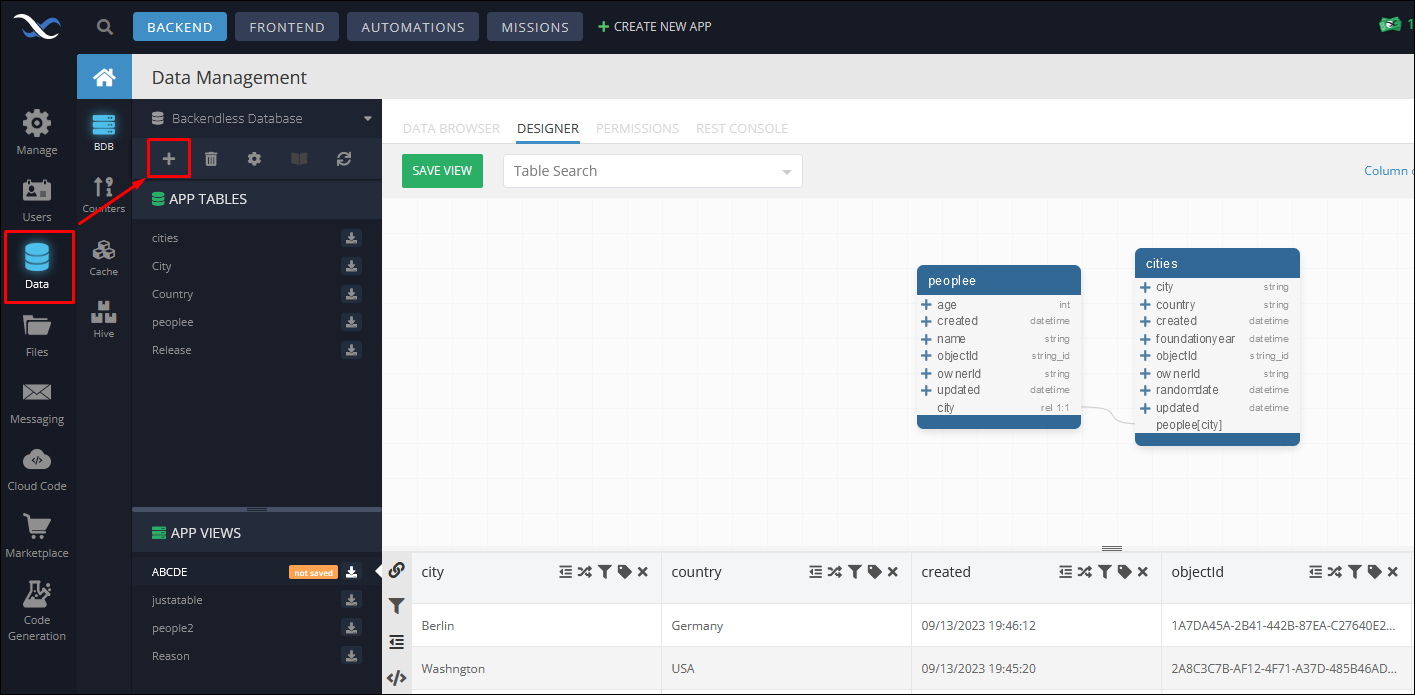
To create a new data view navigate to the Data -> BDB, then click the + sign in the toolbar.

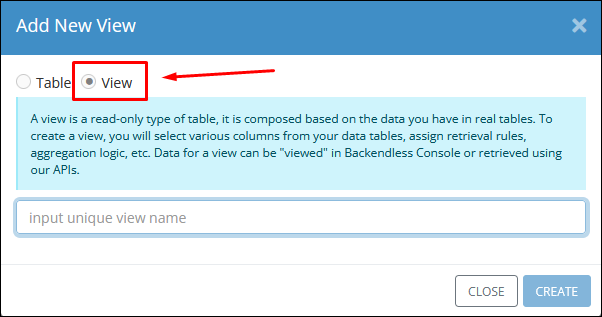
In the pop-up menu select the View, enter the name of the new view and proceed with selecting the data table and the corresponding columns for a new view:

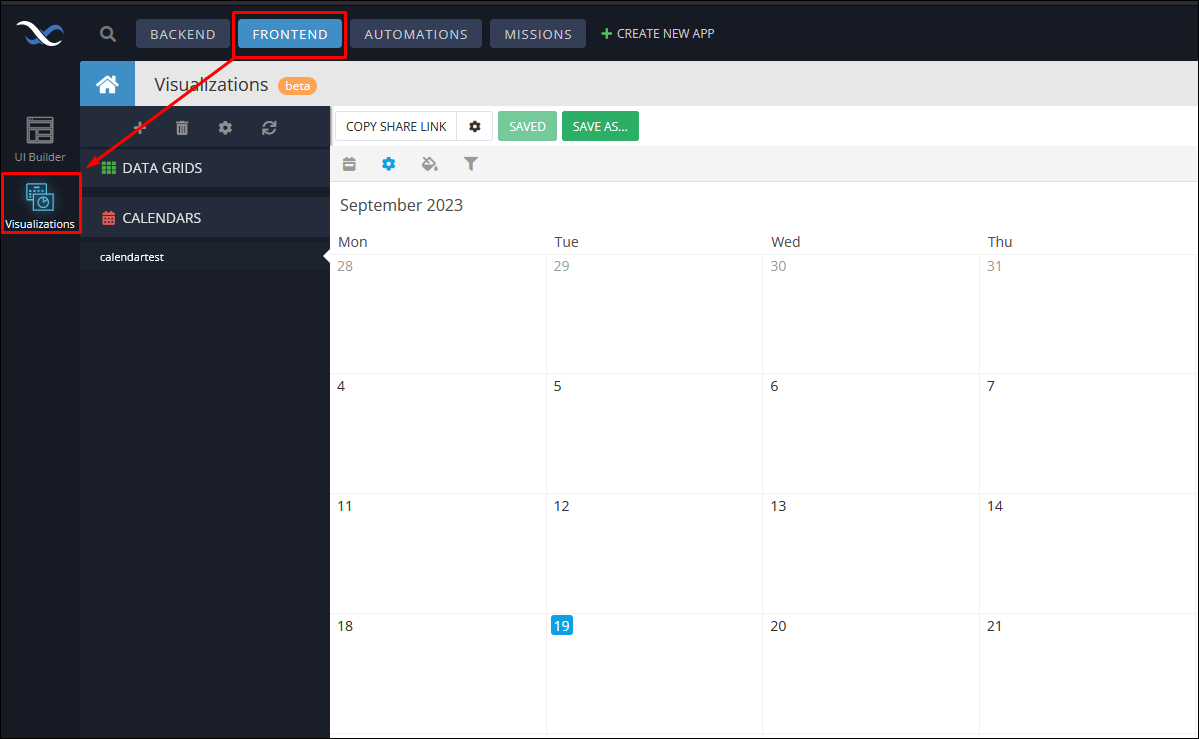
After creating a new data view you can use it as a source of data for your visualization that can be created by navigating to the Frontend -> Visualizations:
