Running/Debugging on Mobile
Introduction
Debugging an application built with UI Builder in a Native Flutter Shell environment presents unique challenges. In this environment, the application is rendered within a web view component, facilitated by a special 'bridge' that enables two-way communication between your page's logic and the native mobile functionalities. This setup, while efficient, creates a degree of isolation for the UI logic within the shell process, complicating the debugging process on mobile devices.
For instance, when a UI Builder page is run in a desktop browser, developers can utilize the print block to output values directly to the browser’s console window, found in the DevTools section. However, this straightforward approach isn't available on mobile, where there's no equivalent of a console window. Therefore, when the same print block is used in logic on a mobile page, the absence of a traditional output console necessitates alternative debugging methods.
This section is dedicated to guiding developers through different debugging mechanisms specifically designed for mobile experiences created with UI Builder. These tools and techniques are tailored to overcome the challenges posed by the mobile environment, ensuring efficient and effective debugging practices.
Running on Mobile
Deploying your UI Builder apps on mobile devices can be approached in several ways, each offering a unique blend of setup complexity and functionality support. This guide will assist you in choosing the method that best suits your needs.
- Using Mobile Browser: Simple yet L:imited. One of the most straightforward methods is using a mobile browser. By simply publishing your UI Container and accessing the URL on a mobile browser, you can quickly view your app. However, this simplicity comes with limitations; your app will be subject to the restrictions of a browser environment, notably the unavailability of Mobile Native APIs.
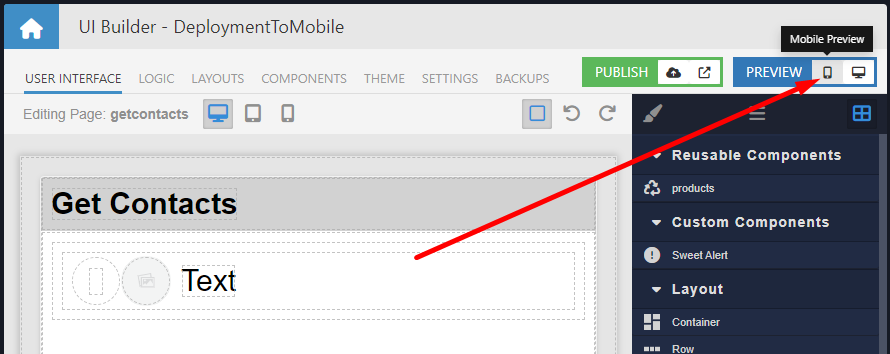
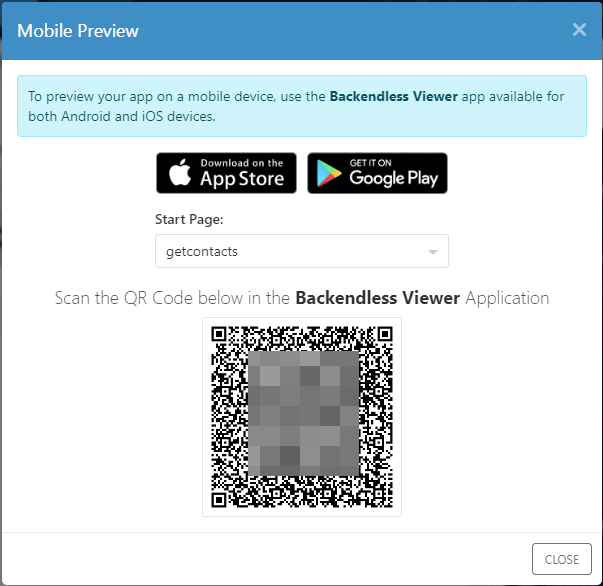
- Using Backendless Viewer. For a more enhanced mobile experience, consider the Backendless Viewer, an application available in both Google and Apple app stores. This tool allows you to run a page from your UI Builder app in a native mobile environment, supporting all Mobile Native APIs. The process is straightforward: download the Backendless Viewer, and use it to run your page, ensuring an experience identical to a native app. This method is visually represented in the UI Builder with the Mobile Preview icon and a popup containing a QR code. The QR code must be scanned using the Backendless Viewer app on your mobile device to facilitate the process of running the selected page on the device:
- Using Native Flutter Shell. For a full native experience, deploying your app into the Flutter Shell is the most comprehensive method. Detailed in the Configuring Flutter Shell section of this documentation, this process involves several steps including deploying your UI Builder app's container, creating a zip file, and integrating it into the Flutter project. Once completed, you can run the project on a connected mobile device. While this method is the most involved, it offers a complete native experience with the support of all Mobile Native APIs.
Debugging on Mobile
Debugging a UI Builder app on a mobile device is a multifaceted process, encompassing UI rendering, client-server integration, and native mobile functionality. This section provides insights and techniques for effectively debugging your application in a mobile environment.
UI Rendering: Leveraging CSS for Responsive Design
The appearance of your UI Builder apps on mobile is largely governed by CSS, which is accessible in UI Builder Themes and Extensions. CSS is a powerful tool for crafting responsive designs, essential for a seamless mobile experience. For those new to mobile design, it's advisable to consult resources like the Mozilla Developer Network, which offers comprehensive articles on this topic.
Inspecting UI on Desktop for Mobile Debugging
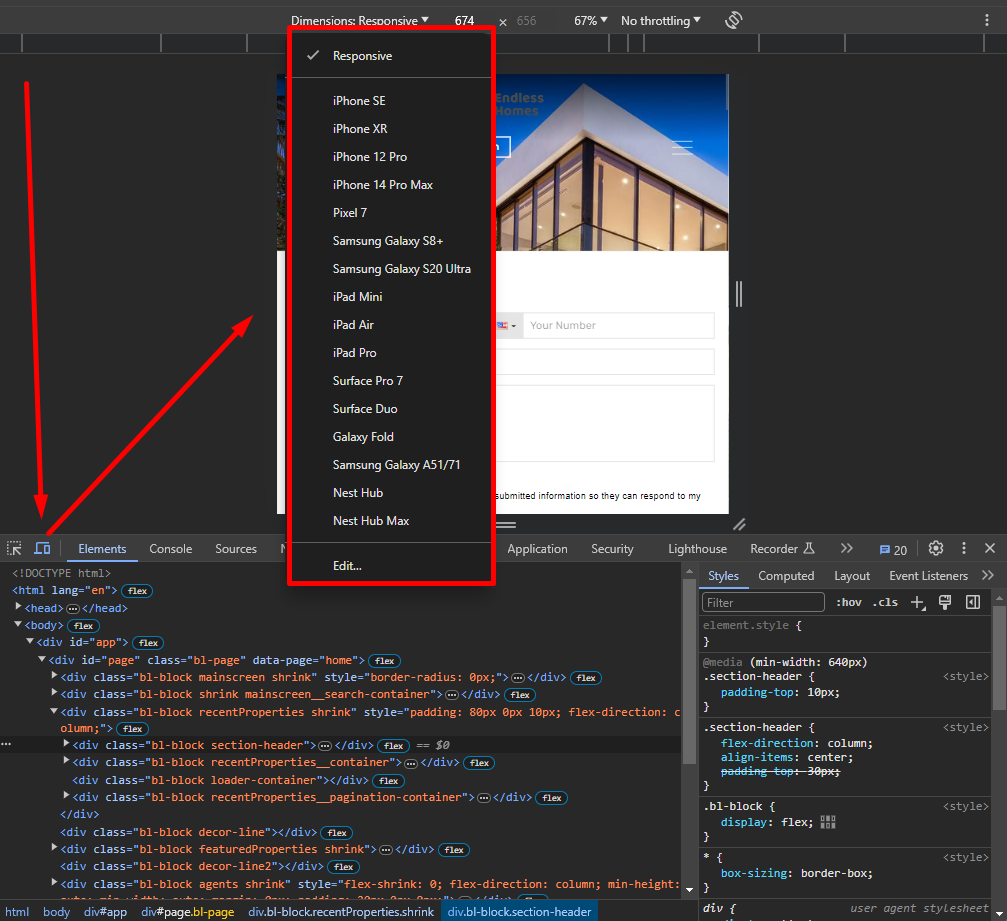
To closely inspect UI elements, such as style application and HTML structure, it's more convenient to use a desktop browser. This can be done by running the app in a desktop browser and enabling the Device Toolbar in the browser's DevTools. This approach allows for a detailed examination of how the UI is rendered, which can be challenging to do directly on a mobile device.
Client-Server Integration: Network Monitoring
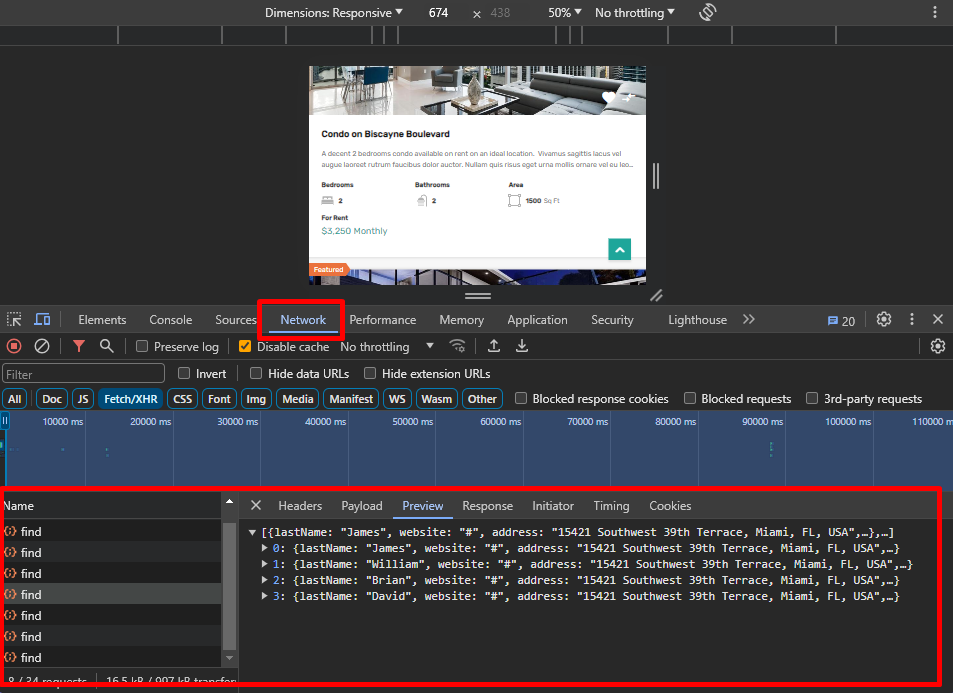
Monitoring the client-server communication, whether with Backendless or other third-party servers, is crucial. The Network tab in a desktop browser’s DevTools is invaluable for this, displaying all client-server interactions. It provides detailed information including request URLs, headers, body, and any errors. However, this visual feedback is typically accessible only in the desktop version of web browsers.
Debugging with Print Blocks
Understanding your app's internal state during the debugging process is crucial. In Backendless UI Builder, this is facilitated by the Codeless "print" block. This block is an integral part of the Codeless visual programming system, designed to work in tandem with the DevTools when the page(s) run in desktop browsers.
When developing with Backendless UI Builder, you can utilize the "print" Codeless block within your app's logic. This block allows you to pass any value, which could be a simple string, a number, an array/list or more complex objects like the result of an API request. When the logic containing the "print" block executes, these values are displayed in the Console panel of the DevTools in your desktop browser.
This collaboration between Backendless UI Builder and browser DevTools provides a streamlined way to monitor and understand the real-time internal state of your app. It becomes particularly useful for inspecting how specific parts of your app are functioning under various conditions and can be a powerful tool in identifying and resolving issues.
By leveraging this feature, you gain the ability to see immediate feedback from your app, aiding in a more efficient and effective debugging process. This is especially valuable when dealing with complex logic or troubleshooting intricate issues within your app's workflow.
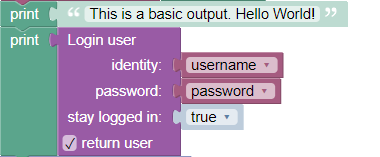
For instance, the below codeless logic demonstrates outputting a string and the result of a Login API request:
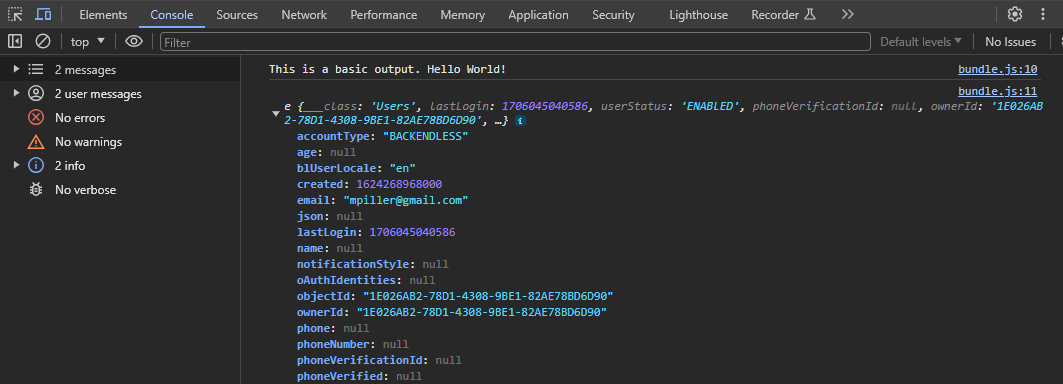
The Console tab then displays these outputs, providing a clear view of the app's processes and responses.
Debugging on Mobile: Techniques and Challenges
While the above methods offer comprehensive insights into your app's workings, they are primarily desktop-based. This raises the question of effective mobile debugging techniques, especially considering that Mobile Native APIs only function on mobile devices and may crash on desktops. The following section will delve into strategies for debugging your app strictly on a mobile device, addressing the unique challenges and tools available in this environment.
Conditional Logic when using Native APIs
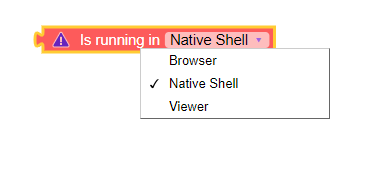
In some cases you may need to branch the logic in your app based on whether it runs in a browser, Native Flutter Shell or Backendless Viewer. This can be accomplished using the "Is Running In" Codeless block:
Using Logging API
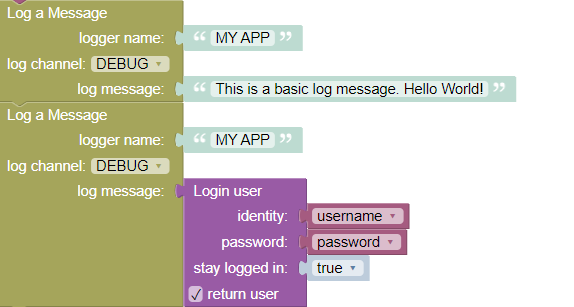
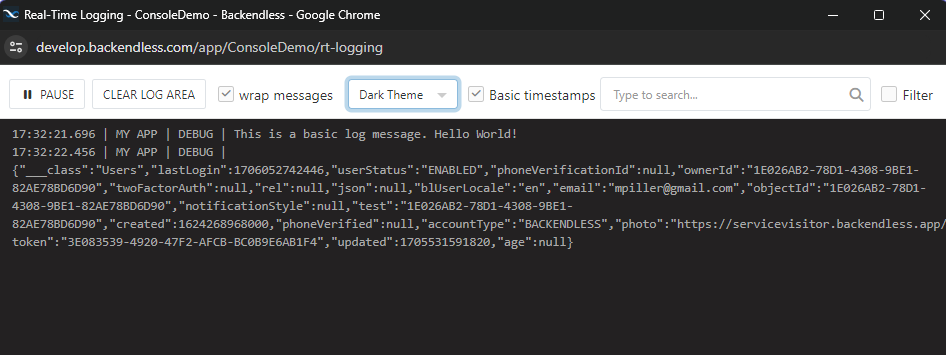
In cases when you need to get some "debugging" feedback from the app (which is where the "print" block comes in handy), Backendless Logging API is an excellent alternative. Log messages sent with the API are handled by the server. They are persisted in a log file and can also be viewed using the Real-Time Logging window. Below is an example of using the logging API to log a basic string message and a result of the User Login API call:
The Real-Time Logging window will show the following:
To access the Real-Time Logging section in Backendless Console, navigate to Manage > Log Management > REAL-TIME LOGGING. Use the Pop Out button to open real-time logging in a separate window:
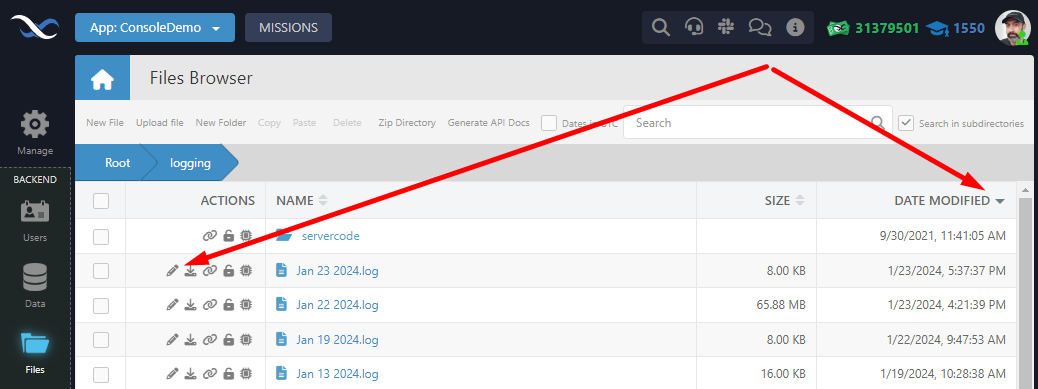
If you would like to access log files, you can find them in the Files section of Backendless Console. Log messages are stored in files, where each file corresponds to a date when the log messages were added. You can sort the log files by date and use the Edit icon to open a file to see its contents:
For additional information see the Backendless Logging documentation.