Overview
The Chart component is a powerful tool for creating visually engaging and informative data visualizations. It enables you to present your data in various chart types, helping users quickly understand and analyze information. With the Chart component, you can transform raw data into meaningful insights within your application. The component supports a variety of chart types, including time line charts, pie charts, and categories charts. You can source the data for the component using the data table or the data view.
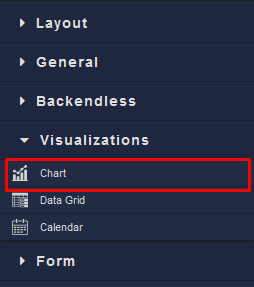
Locating the Chart component in the toolbar:
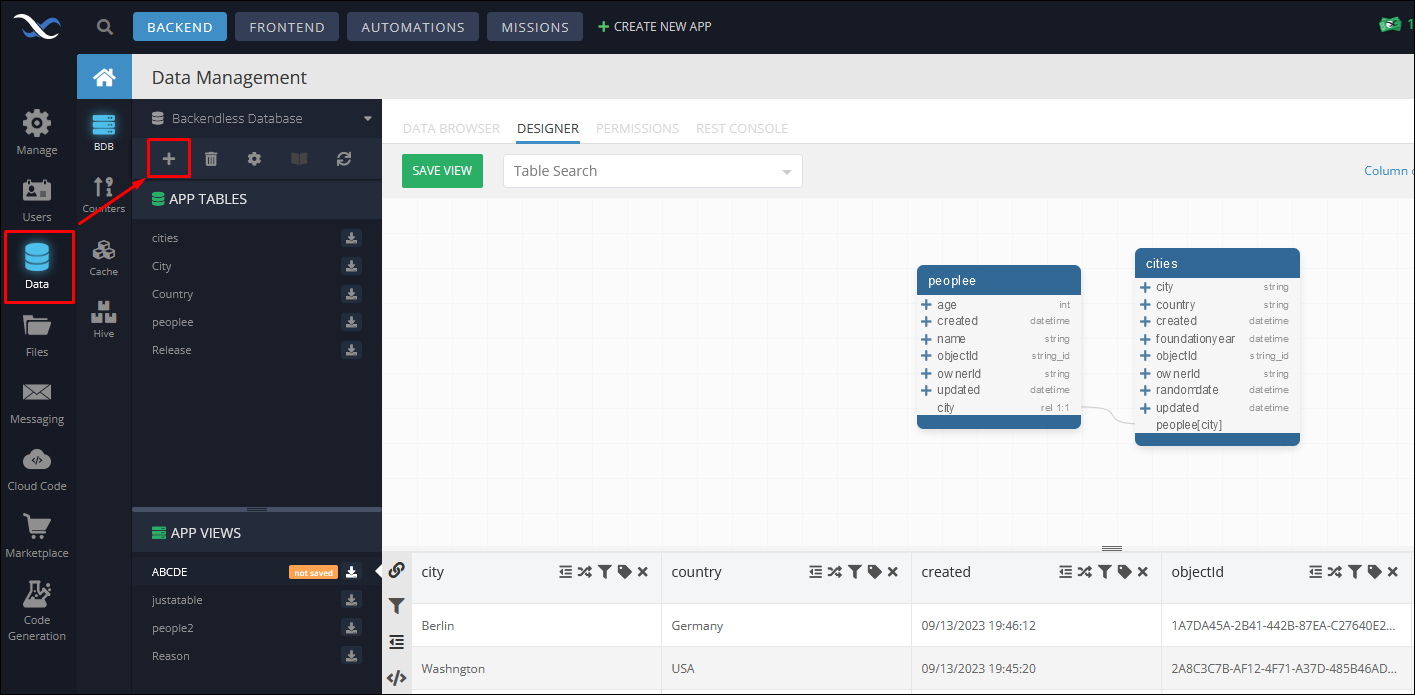
To create a new data view navigate to the Data -> BDB, then click the + sign in the toolbar.
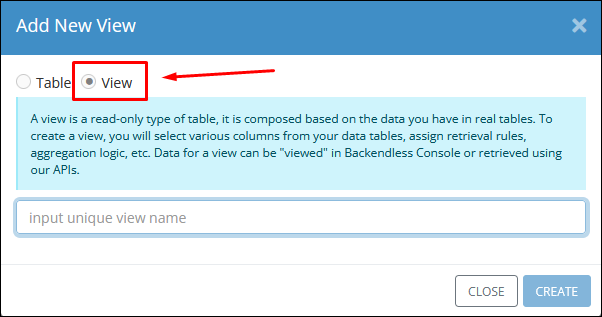
In the pop-up menu select the View, enter the name of the new view and proceed with selecting the data table and the corresponding columns for a new view:
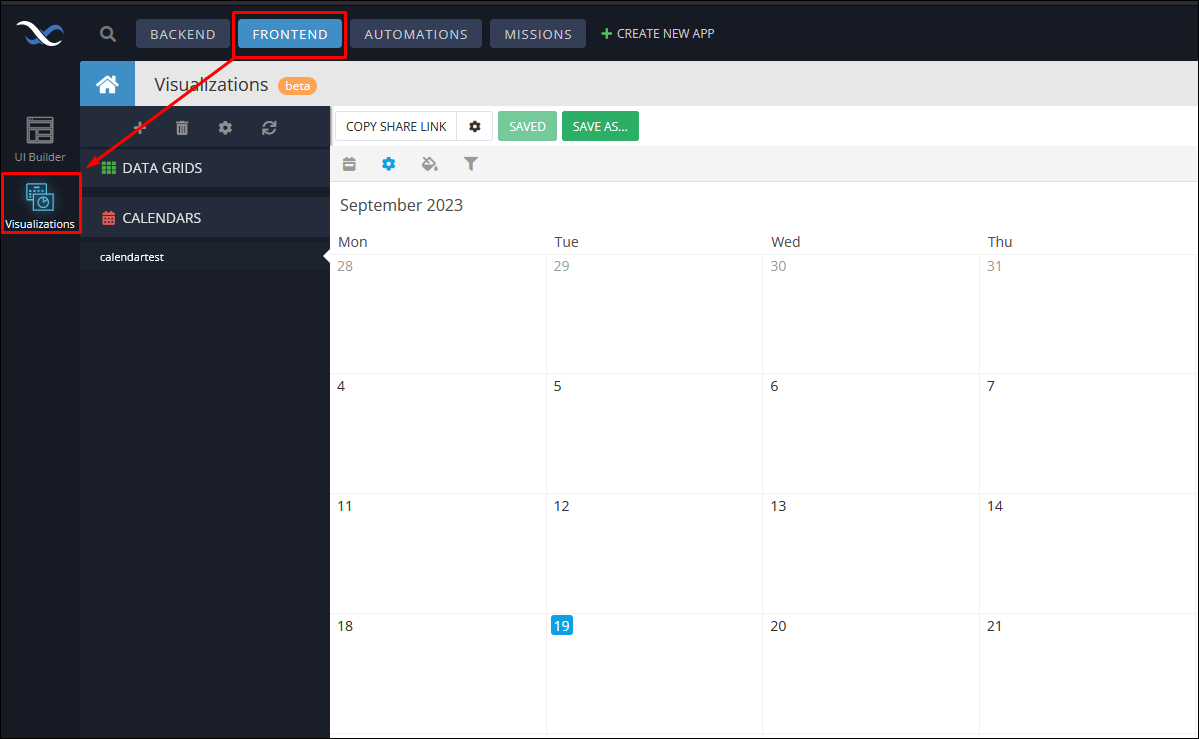
After creating a new data view you can use it as a source of data for your visualization that can be created by navigating to the Frontend -> Visualizations: