Overview
The Calendar component empowers you to visualize and interact with your dataset using a dynamic calendar interface. This component is particularly valuable when working with datasets sourced from Visualizations based on Data Tables or Data Views. In the Calendar visualization, each record within your dataset transforms into a calendar event or appointment, providing an intuitive and organized way to view, manage, and schedule events.
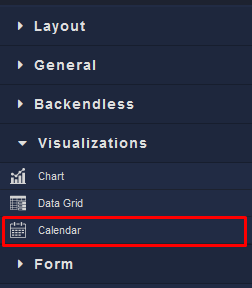
Locating the Calendar component in the toolbar:
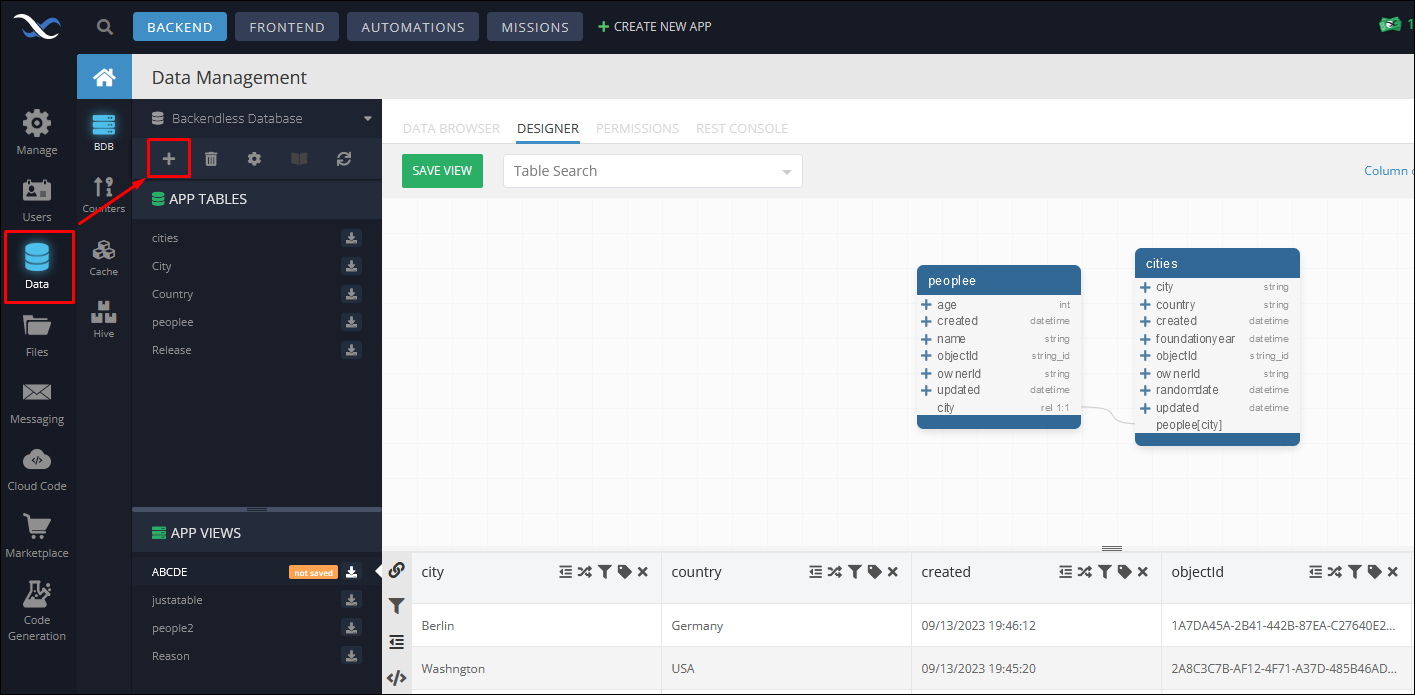
To create a new data view navigate to the Data -> BDB, then click the + sign in the toolbar.
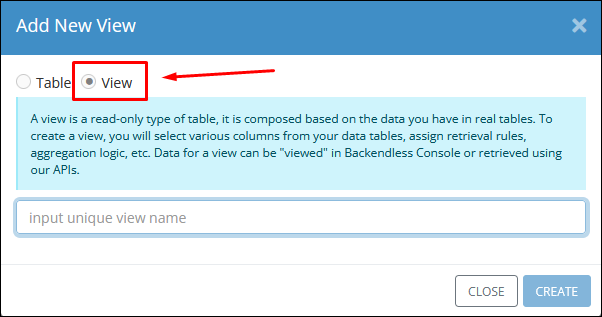
In the pop-up menu select the View, enter the name of the new view and proceed with selecting the data table and the corresponding columns for a new view:
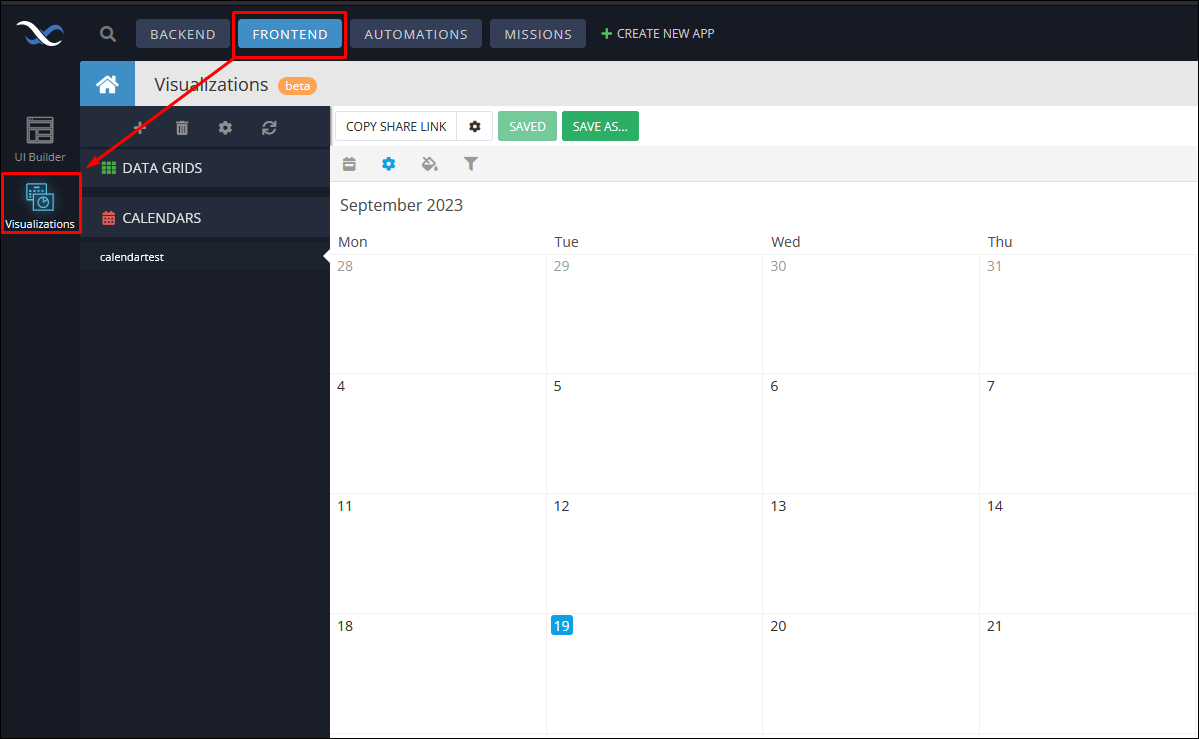
After creating a new data view or data table you can use it as a source of data for your visualization that can be created by navigating to the Frontend -> Visualizations: