Spatial Data Management
Backendless Console is the central place for managing spatial data in Backendless. It provides the following functionality:
- Table schema definition - creating spatial columns, assigning constraints and validators;
- Creating and editing spatial data - populating the database with spatial data using graphical interface;
- Visualizing spatial data on the map;
- Exporting and importing database records with spatial data;
Schema Definition
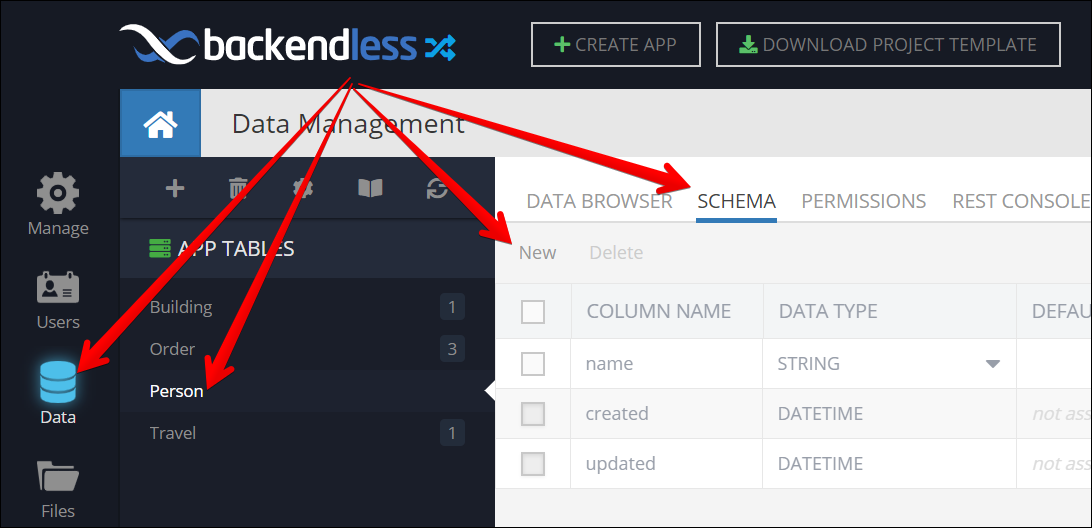
Spatial values must be stored in columns of the POINT, LINESTRING, POLYGON or the GEOMETRY data types. Creating a column with any of these types can be done on the SCHEMA tab of the Data screen. Make sure to select the table where you would like to create a column and click the New button:
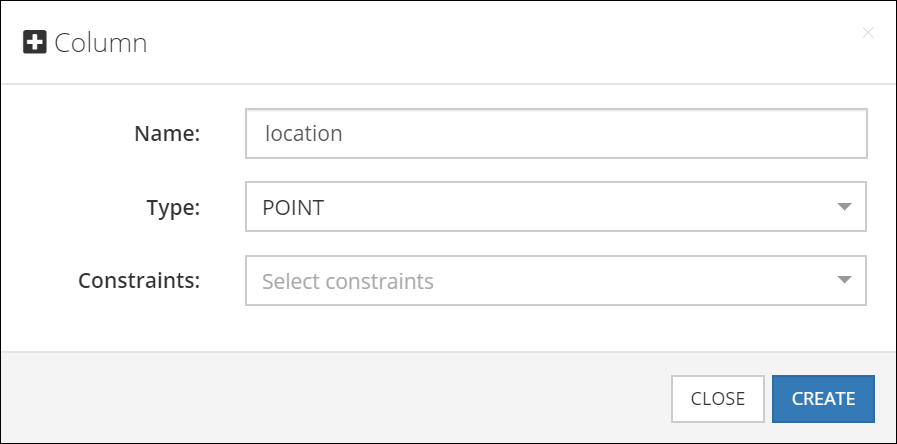
Enter the column name in the New Column popup window and select the data type you would like to assign to the column. For example, the screenshot below shows a new column with the name of location of type POINT being created. For information about available data types, see the Spatial Data Types section of this guide.
Column Constraints
Spatial data type columns in Backendless support the following constraints:
-
Not Null/Required (
NN) - this constrain requires that objects with the spatial value properties saved or updated in the database contain a non-null value. This means when a data object is saved or updated in the database, the properties corresponding to the columns with theNNconstraint have an actual data. Otherwise, a Backendless API call to save/update the object results in an error.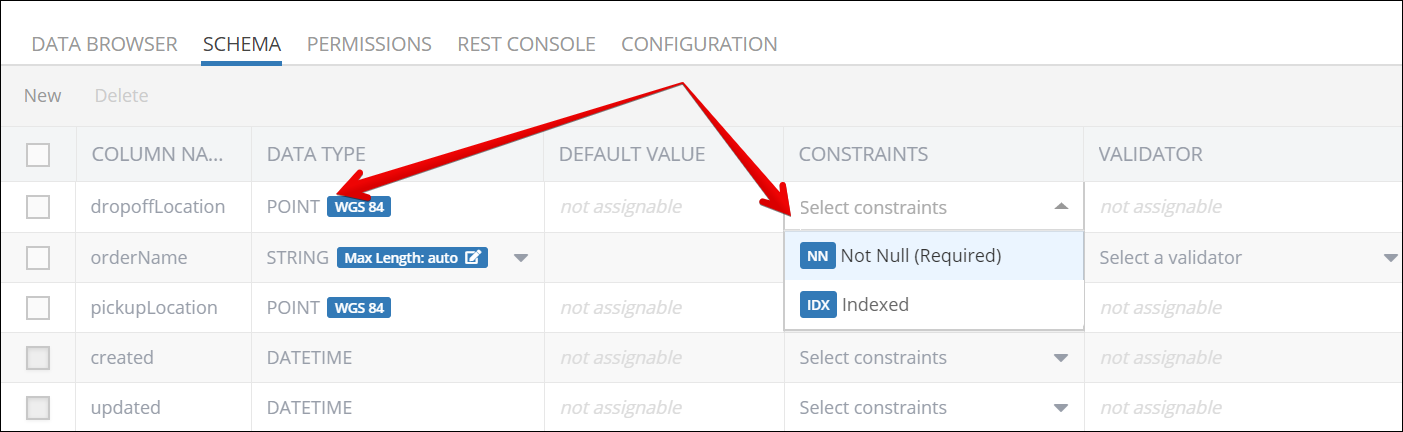
-
Indexed (
IX) - Backendless calculates an internal index for the columns with this constraint. The index significantly speeds up data retrieval when queries reference indexed columns.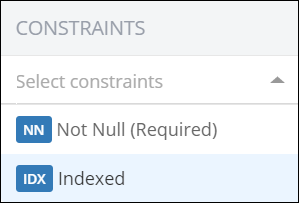
Creating and Editing Data
Backendless Console provides a visual interface for a complete set of editing functions of the spatial data stored in Backendless. The functionality includes:
- Entering new
POINT,LINESTRINGandPOLYGONvalues in the database. - Modifying spatial data values saved in the database
- Deleting spatial data values from the database
There are several ways to enter new and edit existing spatial data values into the database using Backendless Console. Specifically, the following options are available for entering new and editing existing data:
- Inline in a data cell using either the WKT or GeoJSON formats;
- In a geometry editor using either the WKT/ GeoJSON formats or using an interactive map;
In-Cell Editing
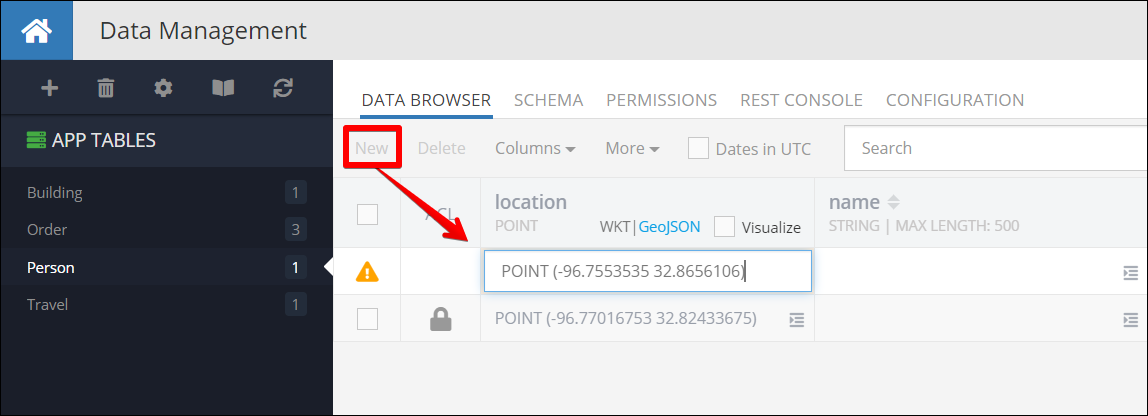
Inline data using either the WKT or the GeoJSON formats. This approach applies to entering data in the DATA BROWSER for the spatial type columns. You can start creating a new object by by clicking New and then enter a WKT or a GeoJSON value as shown below For example, the screenshot below shows a new record is created and a value in the WKT format is entered into the location column:
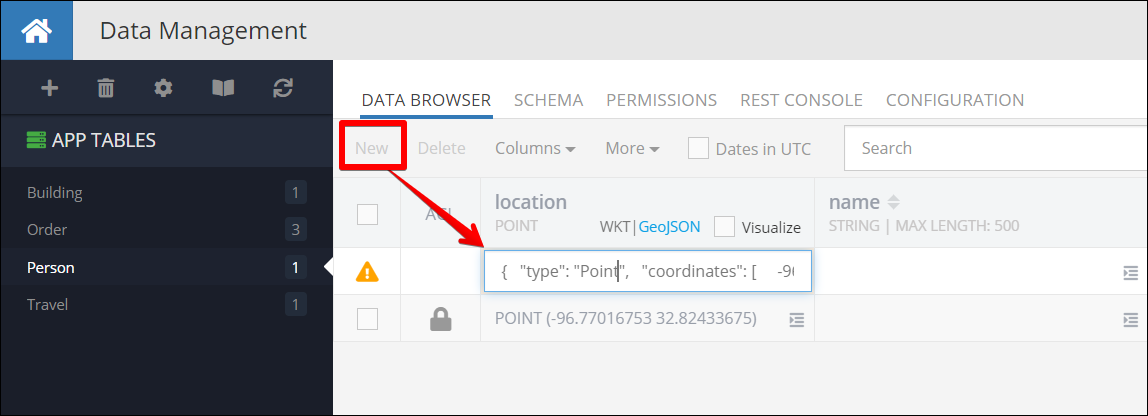
Notice the example above uses the WKT format. Alternatively, Backendless Console can also accept values in the GeoJSON format as shown below:
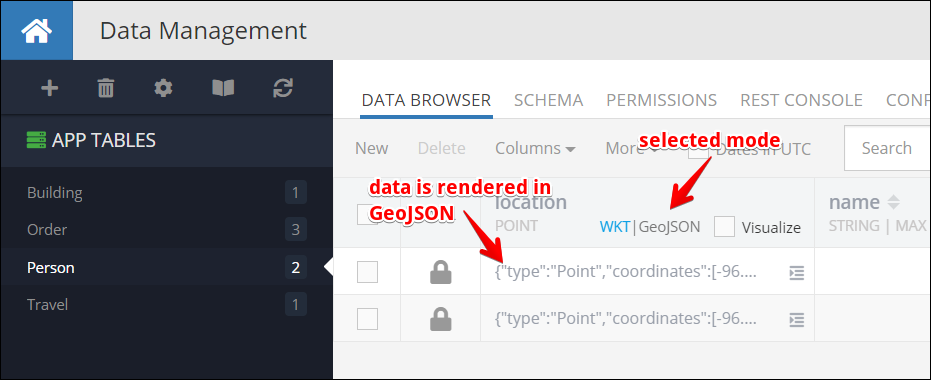
If you already have an existing object in the database in a table with spatial columns, you can edit the value simply by clicking the cell and modifying the contents. You can control the format in which the data is shown in the column by clicking the WKT | GeoJSON toggle as shown below:
Editing in Geometry Editor
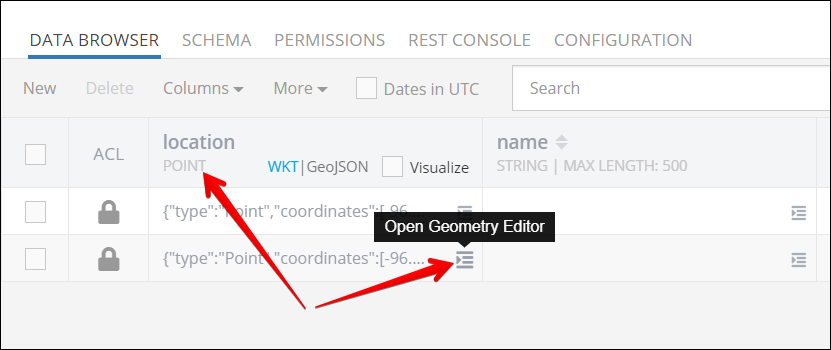
This approach for entering new and editing existing spatial values applies only to objects which are already stored in the database. Cell for any column with the spatial data types display an icon which opens the Geometry Editor. For example, the screenshot below shows the "geometry editor" icon for a column of type POINT:
Clicking the icon opens up a graphical interface for editing the value for the cell when the icon is clicked. For example, when the icon in the screenshot above is clicked, Backendless Console displays the geometry editor as shown below:
Notice that the same icon also appears for the column of types STRING and TEXT, however, clicking the icon for cells of those column types opens up a basic text editor.
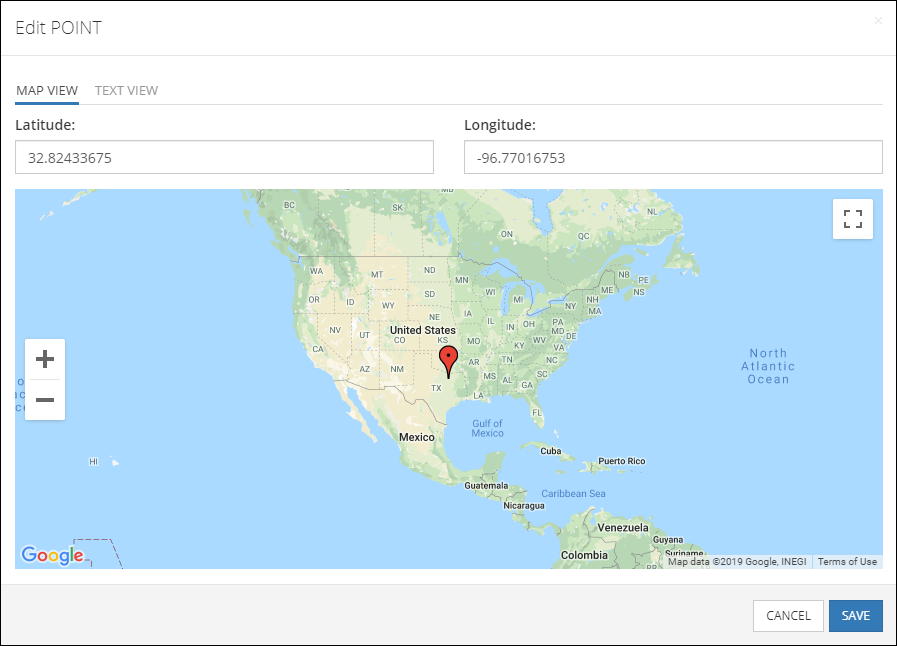
The Geometry Editor contains two tabs: MAP VIEW and TEXT VIEW. Each tab provides a way to set the value of the corresponding spatial type using either an interactive map or a text-based editor. The map view is adapted to allow editing of each of the spatial types supported by Backendless.
For example, to edit a POINT, the interface provides text fields for the Latitude and the Longitude values as shown in the screenshot above. Clicking anywhere on the map selects the coordinates of the clicked location. Alternatively, the coordinates can be edited directly in the Latitude/Longitude text fields. In that case, placement of the marker on the map corresponds to the entered coordinates. To save the value in the database click SAVE.
The user interface is slightly different for the LINESTRING data type. Unlike POINT, it supports multiple coordinates which form a multi-segment line:
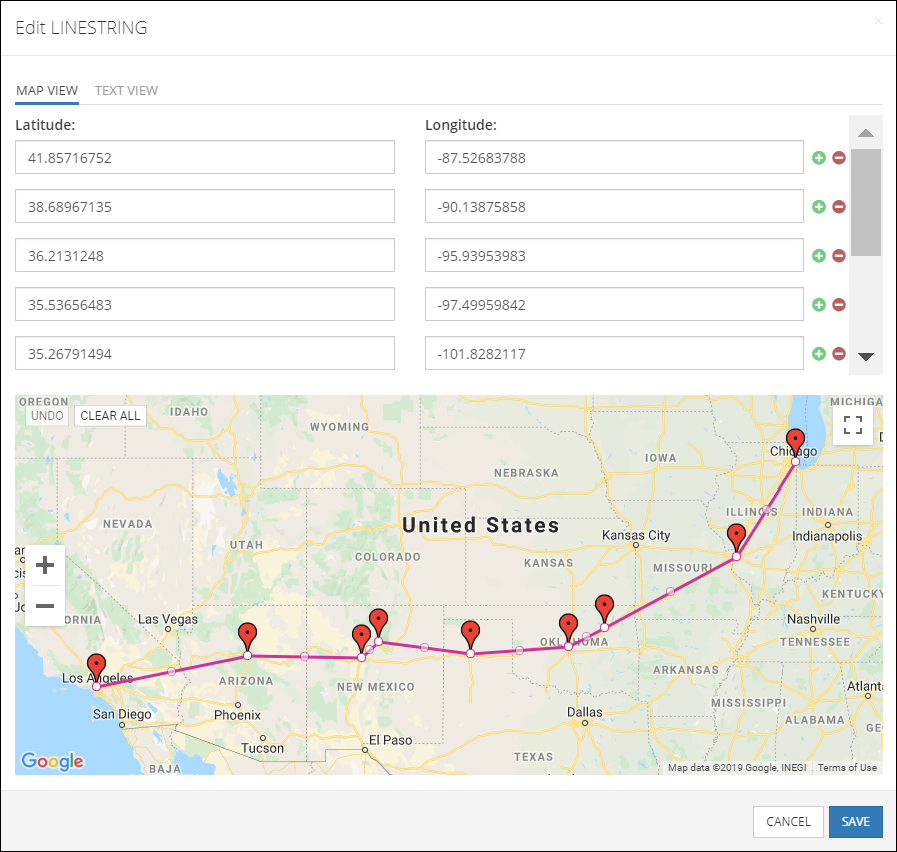
Same as with editing POINT values, you can click on the map to form a line or change the layout of the line. Alternatively, values can be entered using the Latitude and the Longitude text fields. Notice the + and - icons next to the Longitude fields. The icons can be used to insert new points and delete the existing ones.
Finally, the map view editing of POLYGON values allows for the exterior and the interior boundaries which are managed on the corresponding tabs:
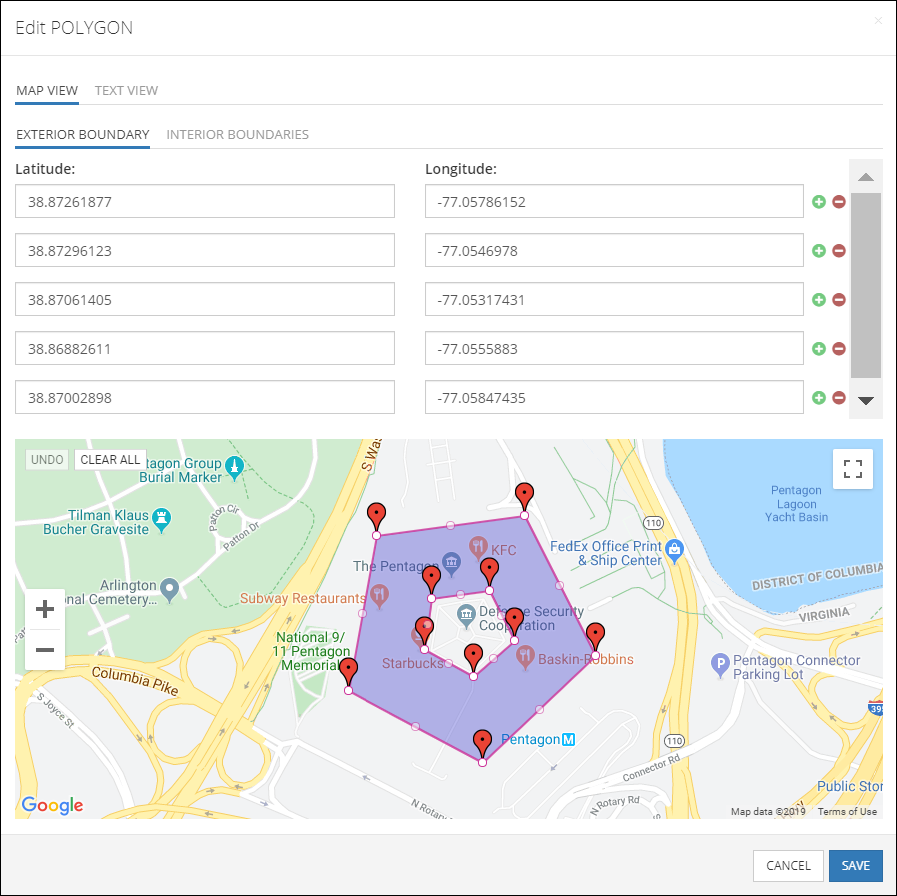
The INTERIOR BOUNDARIES tab is responsible for configuring a hole such as the inner plaza in the Pentagon building in the screenshot above.
Important
The MAP VIEW of the geometry editor supports configuration of only one hole, however, the TEXT VIEW interface supports multiple.
The TEXT VIEW tab for all spatial types has the same user interface:
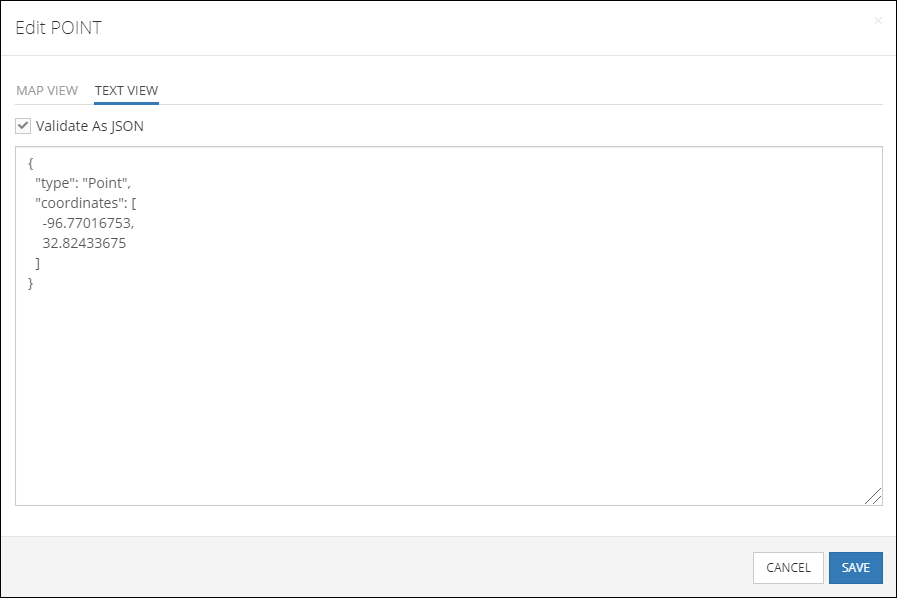
The TEXT VIEW editor supports both WKT and GeoJSON formats.
Visualizing Spatial Data on the Map
Values in the data columns of the spatial types can be visualized on the map to provide a graphical representation of the objects. For example, you may need to run a query against the database and visualize the map-based results. To turn on map visualization for a column, select the Visualize checkbox as shown below:
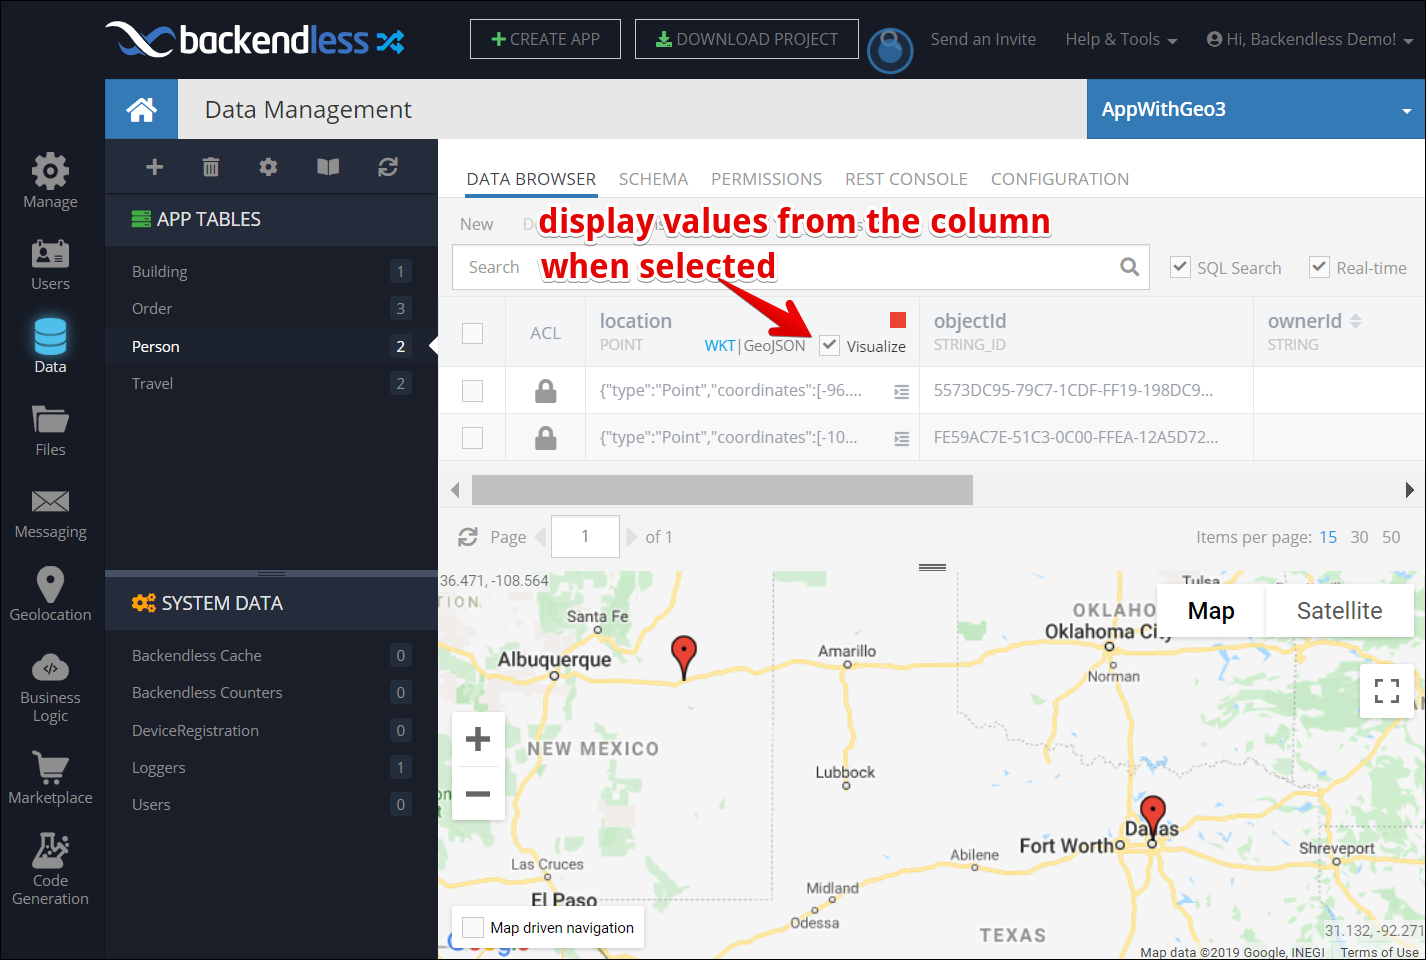
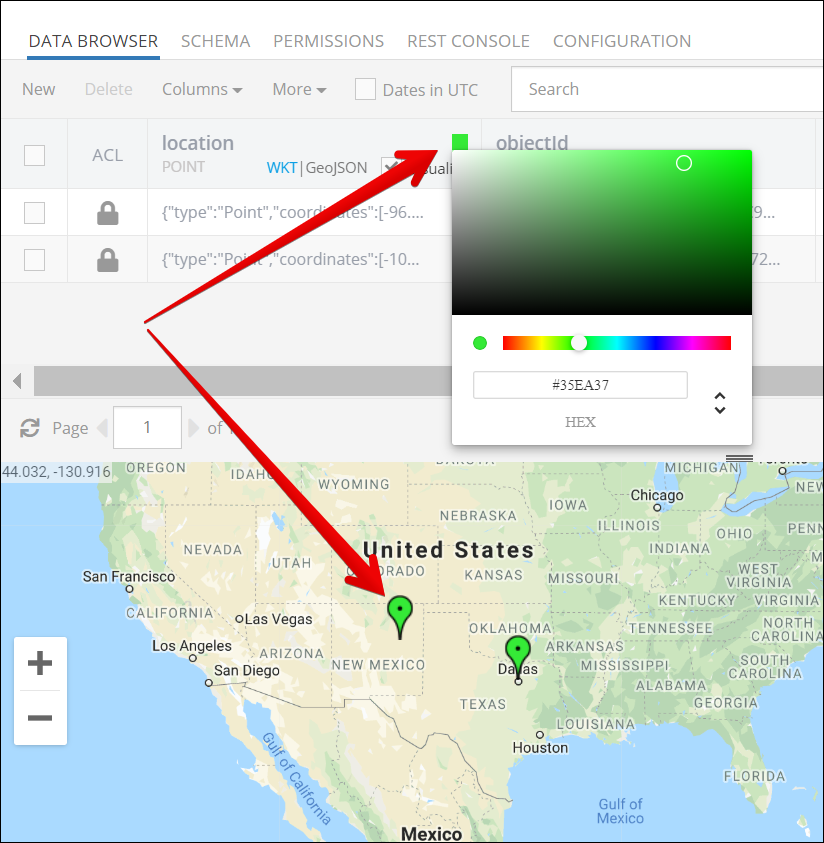
When the Visualize checkbox is selected, all values in the corresponding column for the current view of the data table are rendered on the map. As you can see in the screenshot above, there are two locations indicated by the red pins. The color of the pin can be controlled by the color picker component located above the Visualize checkbox:
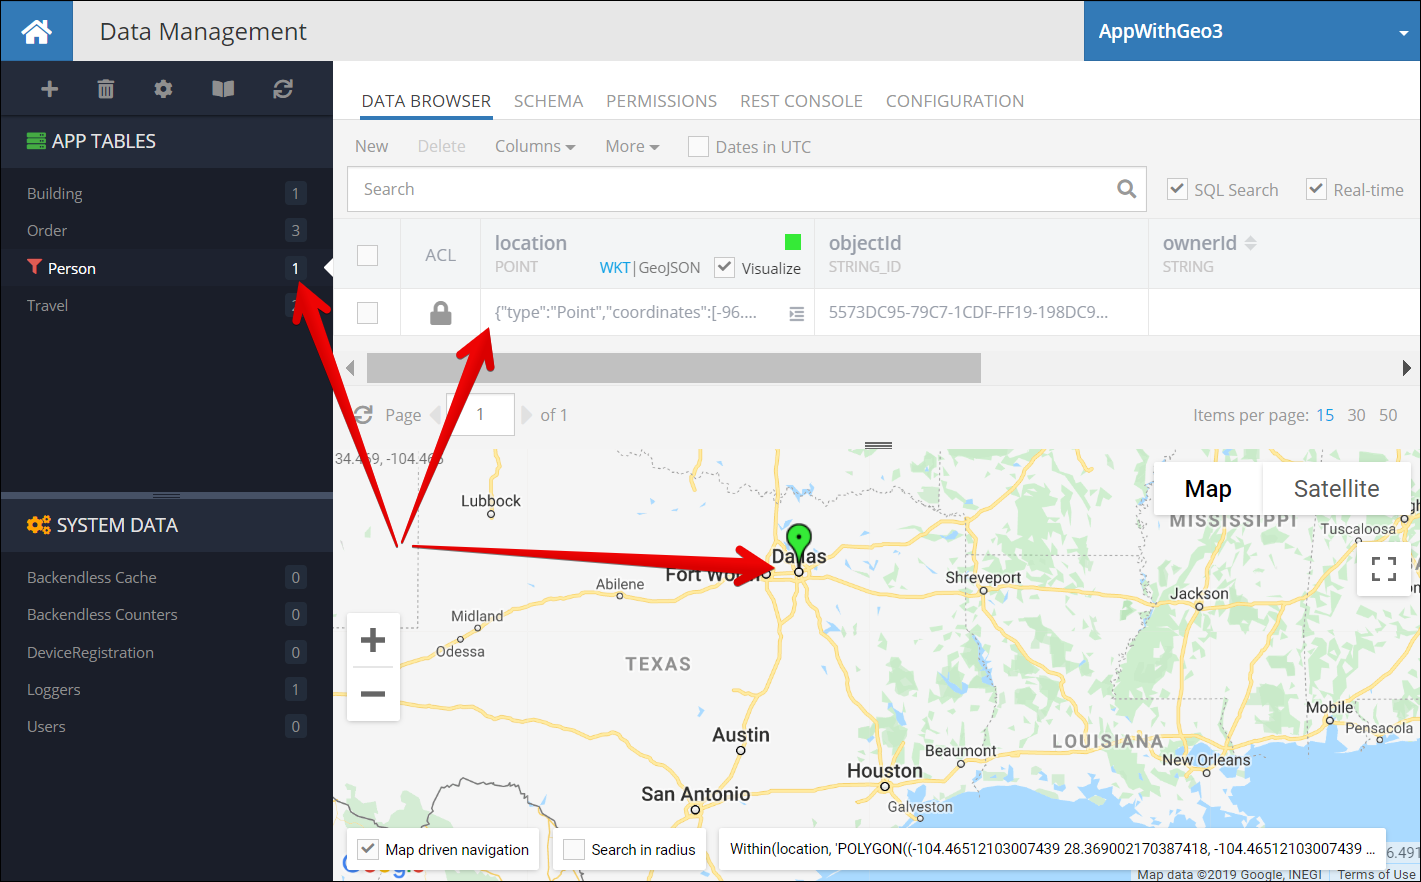
The map interface includes a special feature enabling map-driven search, which means searching for locations within the boundaries of the visible area of the map.

When a location is within the visible map area, the corresponding data object is also displayed in the DATA BROWSER data grid. Backendless Console reruns the search any time you pan or zoom the map. For example, in the screenshot above there are two locations on the map (one in Texas and the other in New Mexico), as a result, there are two objects displayed in the currently selected data table (see the object count next to the table name - Person). If the map is zoomed to Texas, the map and the data show only one location/object:
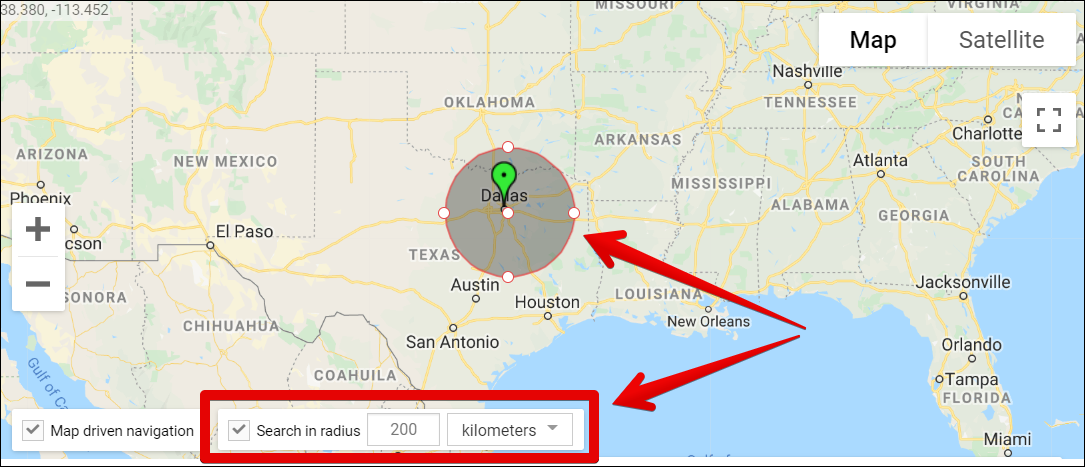
There is also an option to search in radius for the columns of type POINT - see the Search in radius checkbox located to the right of Map driven navigation. When the checkbox is selected, the map displays a circle which you can move around and change the radius by using drag points. Notice you can also specify the radius in various units in the Search in radius form (shown only when the checkbox is selected). When the circle is moved or the radius is change, Backendless runs a search and displays any locations within the circle.
Backendless Console includes a very useful element when using Map driven navigation - a dynamically generated where clause which can be used to make the same request as the one made by console. This applies to requests within the map boundary and search in radius. For example, for a map boundary search, you will see the following:
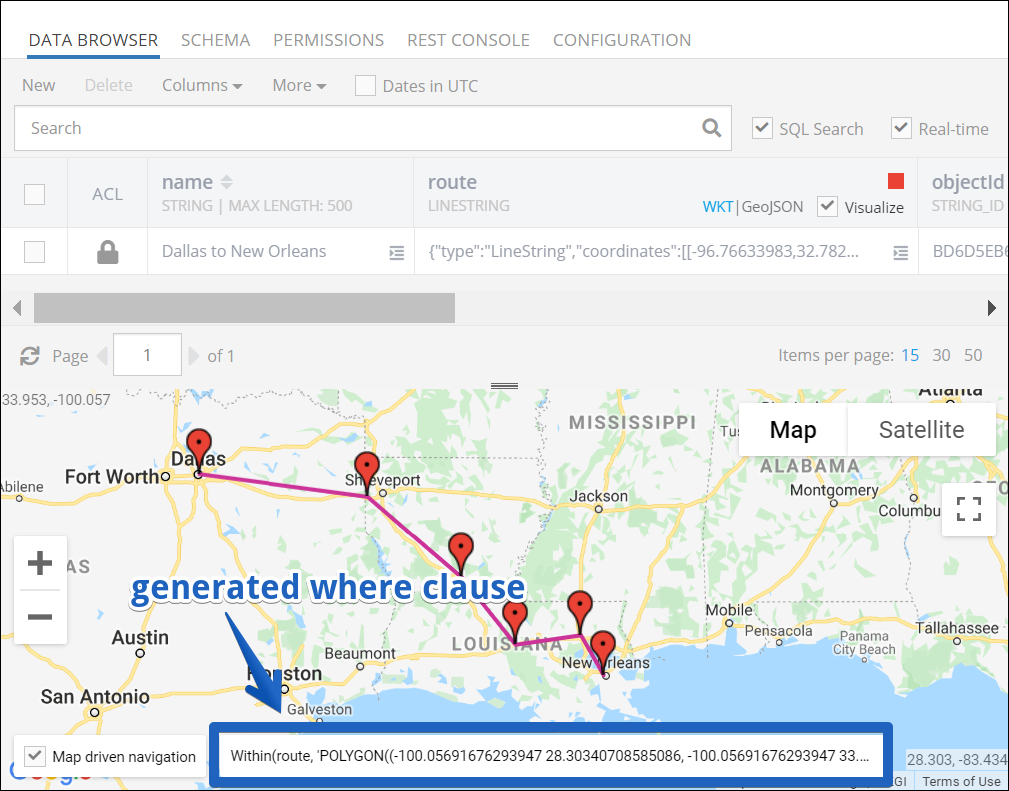
Clicking the where clause area copies the value into the computer clipboard.
Import and Export
Spatial data columns have a special notation in the CSV files used in the Backendless export/import process. Consider a table which contains columns of type POINT, LINESTRING and POLYGON. The names of the columns respectively are location, route and shape:
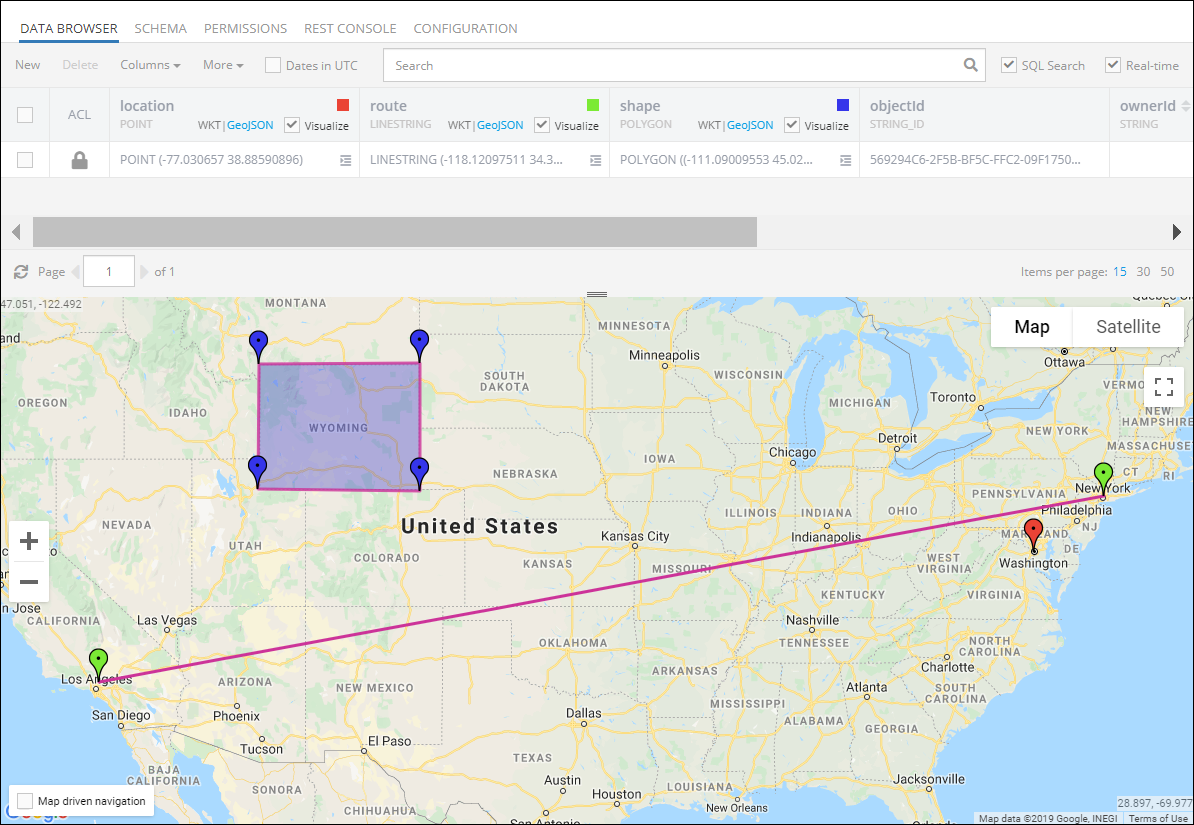
Export of the data table produces the following file:
"location(POINT(4326))", |
"route(LINE_STRING(4326))", |
"shape(POLYGON(4326))", |
"objectId(STRING_ID)", |
"ownerId(STRING(36))", |
"created(DATETIME)", |
"updated(DATETIME)" |
|---|---|---|---|---|---|---|
"POINT(-77.030657 38.88590896)", |
"LINESTRING(-118.12097511 34.31371717,-73.97353525 40.79413554)", |
"POLYGON((-111.09009553 45.02107056,-104.01490022 45.05212473,-104.01490022 40.94042993,-111.13404084 41.00678837,-111.09009553 45.02107056))", |
"XXXX-XXXX" |
null, |
"Thu Nov 2122:28:04 UTC 2019", |
"Thu Nov 21 22:28:57 UTC 2019" |
An unformatted version of the CSV file is:
"location(POINT(4326))","route(LINESTRING(4326))","shape(POLYGON(4326))","objectId(STRING_ID)","ownerId(STRING(36))","created(DATETIME)","updated(DATETIME)"
"POINT(-77.030657 38.88590896)","LINESTRING(-118.12097511 34.31371717,-73.97353525 40.79413554)","POLYGON((-111.09009553 45.02107056,-104.01490022 45.05212473,-104.01490022 40.94042993,-111.13404084 41.00678837,-111.09009553 45.02107056))","569294C6-2F5B-BF5C-FFC2-09F175060D00",null,"Thu Nov 21 22:28:04 UTC 2019","Thu Nov 21 22:28:57 UTC 2019"
As you can see, the general format of spatial columns in the CSV file is:
columnname(TYPE(SRS_ID))
where supported TYPE is POINT, LINESTRING and POLYGON. The SRS_ID must be set to 4326 as shown in the example above.