Introducing Backendless Database View Designer
Views in Backendless Console are a powerful way to explore your data visually by composing datasets of related records in less time than writing queries.
View Designer is an interactive tool for creating Backendless Views. A view is a virtual data table that supports only data retrieval. As the records in the underlying tables are added/modified/deleted, however, the view will automatically reflect these changes.
Views are designed to make it easier to visually explore and display the data in your Backendless Database. With a view, you can combine data from related tables, transform, aggregate, group, and condition data, and all of the complexity is handled through a user-friendly visual interface.
Once your view is created, you can use the API you are already familiar with to retrieve the View data exactly as you composed it.
If you’ve spent any time working in Backendless Database, you know that it is very feature rich. You can do a lot of different things with your data, such as retrieve relational data, massage it, aggregate it, rename properties, group, etc.
Previously, to take advantage of all these features, you had to understand how the APIs work. Now, you can simply do all of it visually by creating a view. Then, you simply use the built-in View Code Generator to plug the view’s query into your application.
Views make it easy to visually build queries for your data. With the View Designer, you instantly see the result of the query, making it easy to tweak and modify your query until it’s just right.
Since all views use the same underlying data, if the data is modified in the database, it will be updated in all views that utilize that data. All of your views can be saved so you can easily come back to them on a weekly or monthly basis to review the data as it develops.
For this article, we’re going to use an example database of fictitious movies. We have a table for films with a variety of relations such as category, actors, actresses, and language.
For more about Views, you can watch our five-part Views video playlist here.
Creating a View
To create a view, click the + icon just as you would to create a table. You will now be given a choice between creating a table or a view.
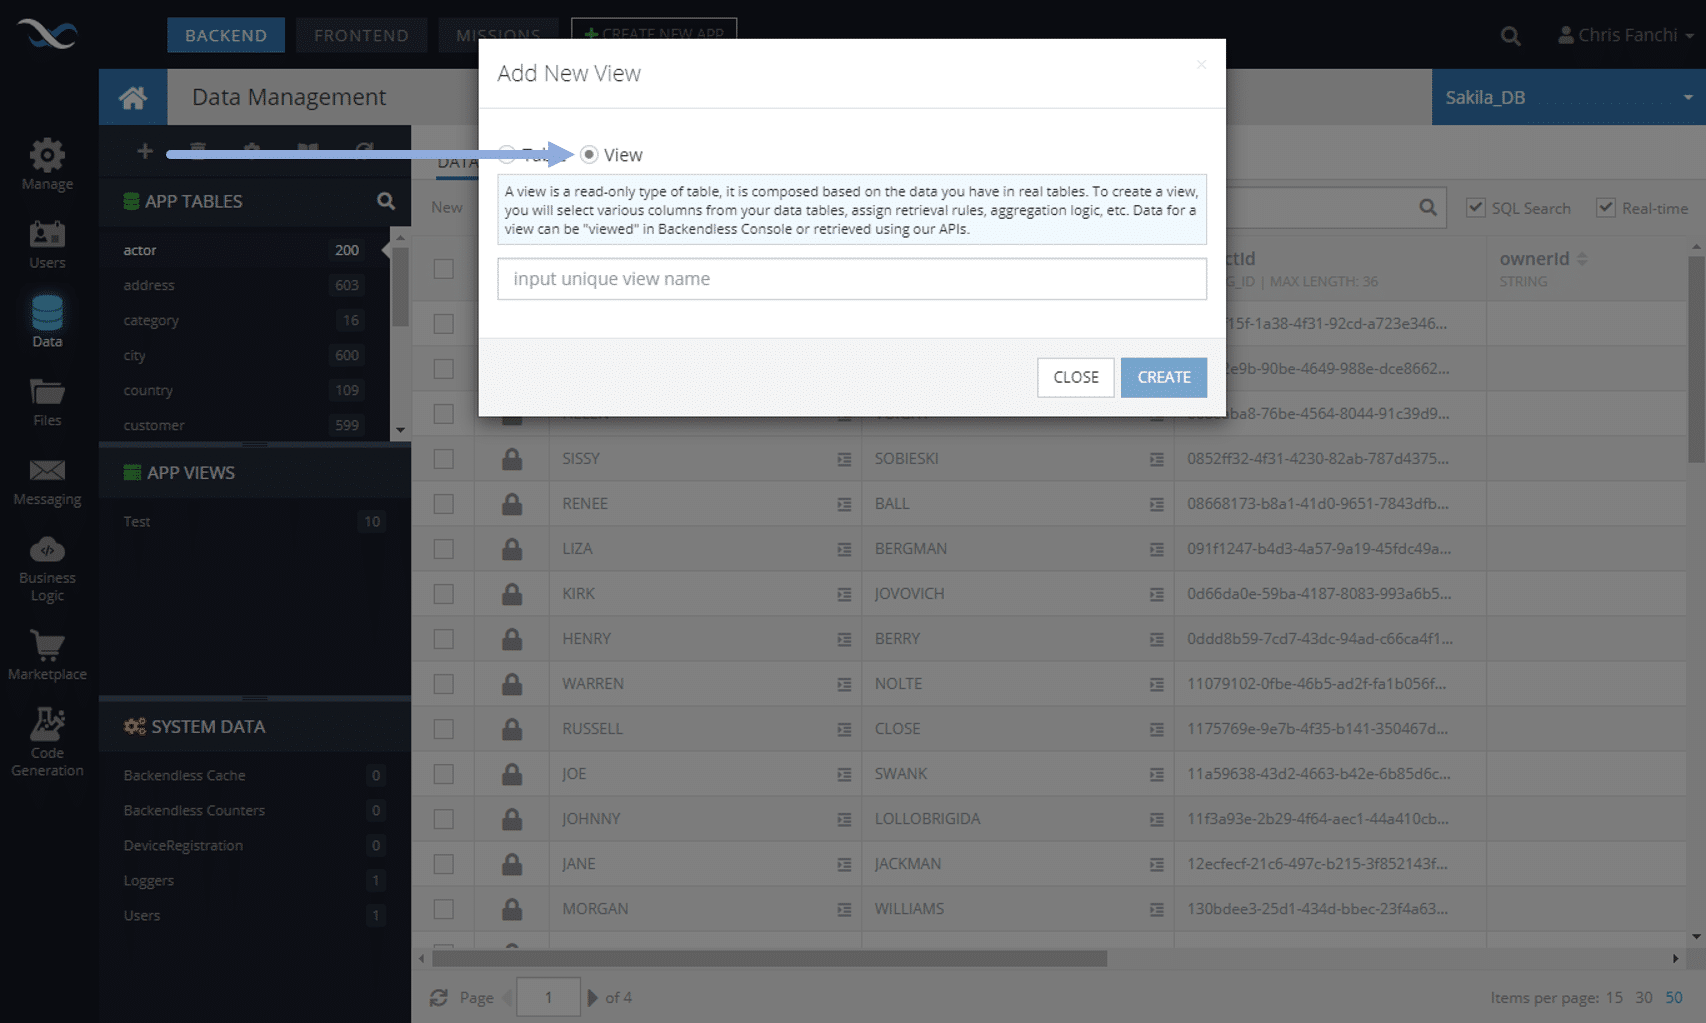
The view name can contain any characters including space, dash, etc,, and may be in any language. When a view is created, it shows up in a section called App Views:

Designing a View
To design a view, you simply selects the + next to the columns you want to use. For our first example, we will select the column title from the film table.
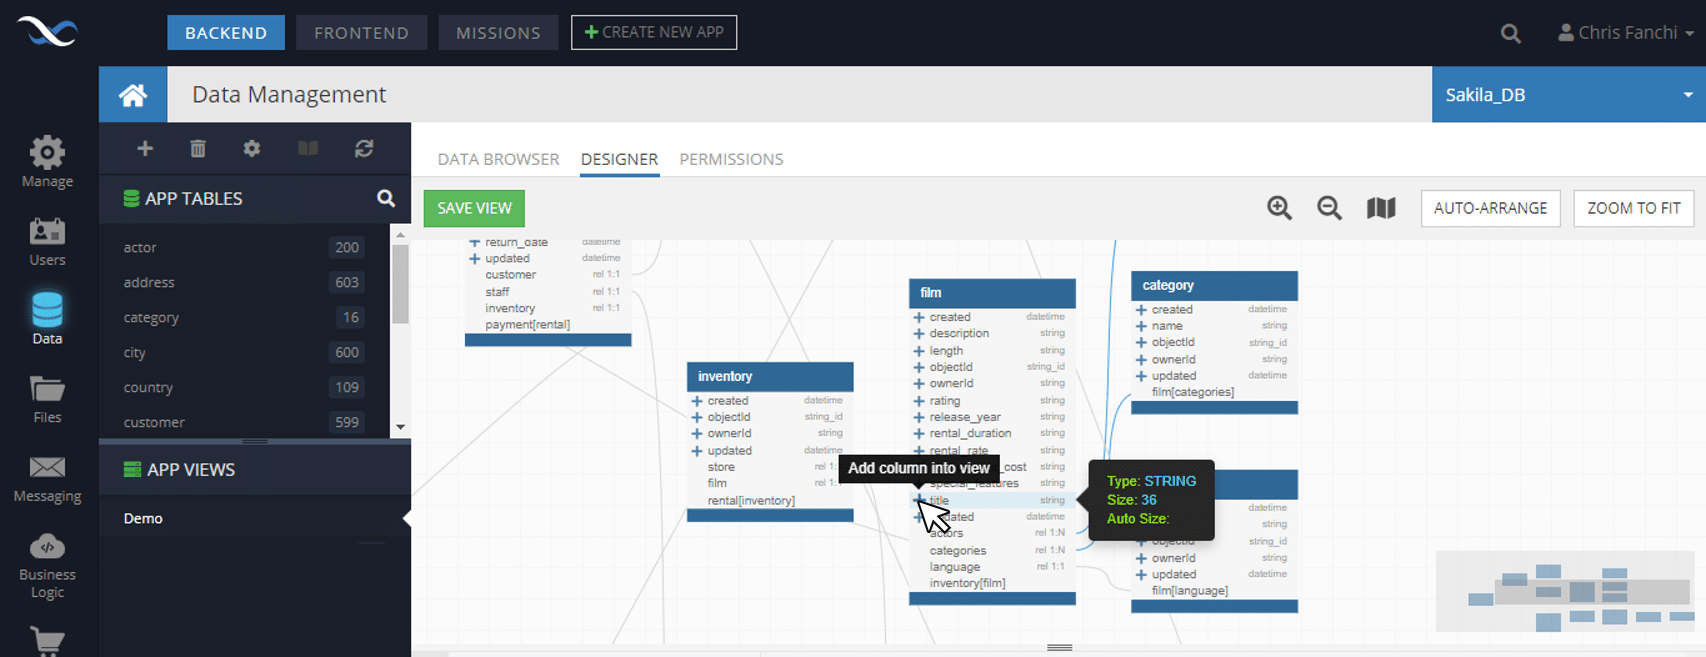
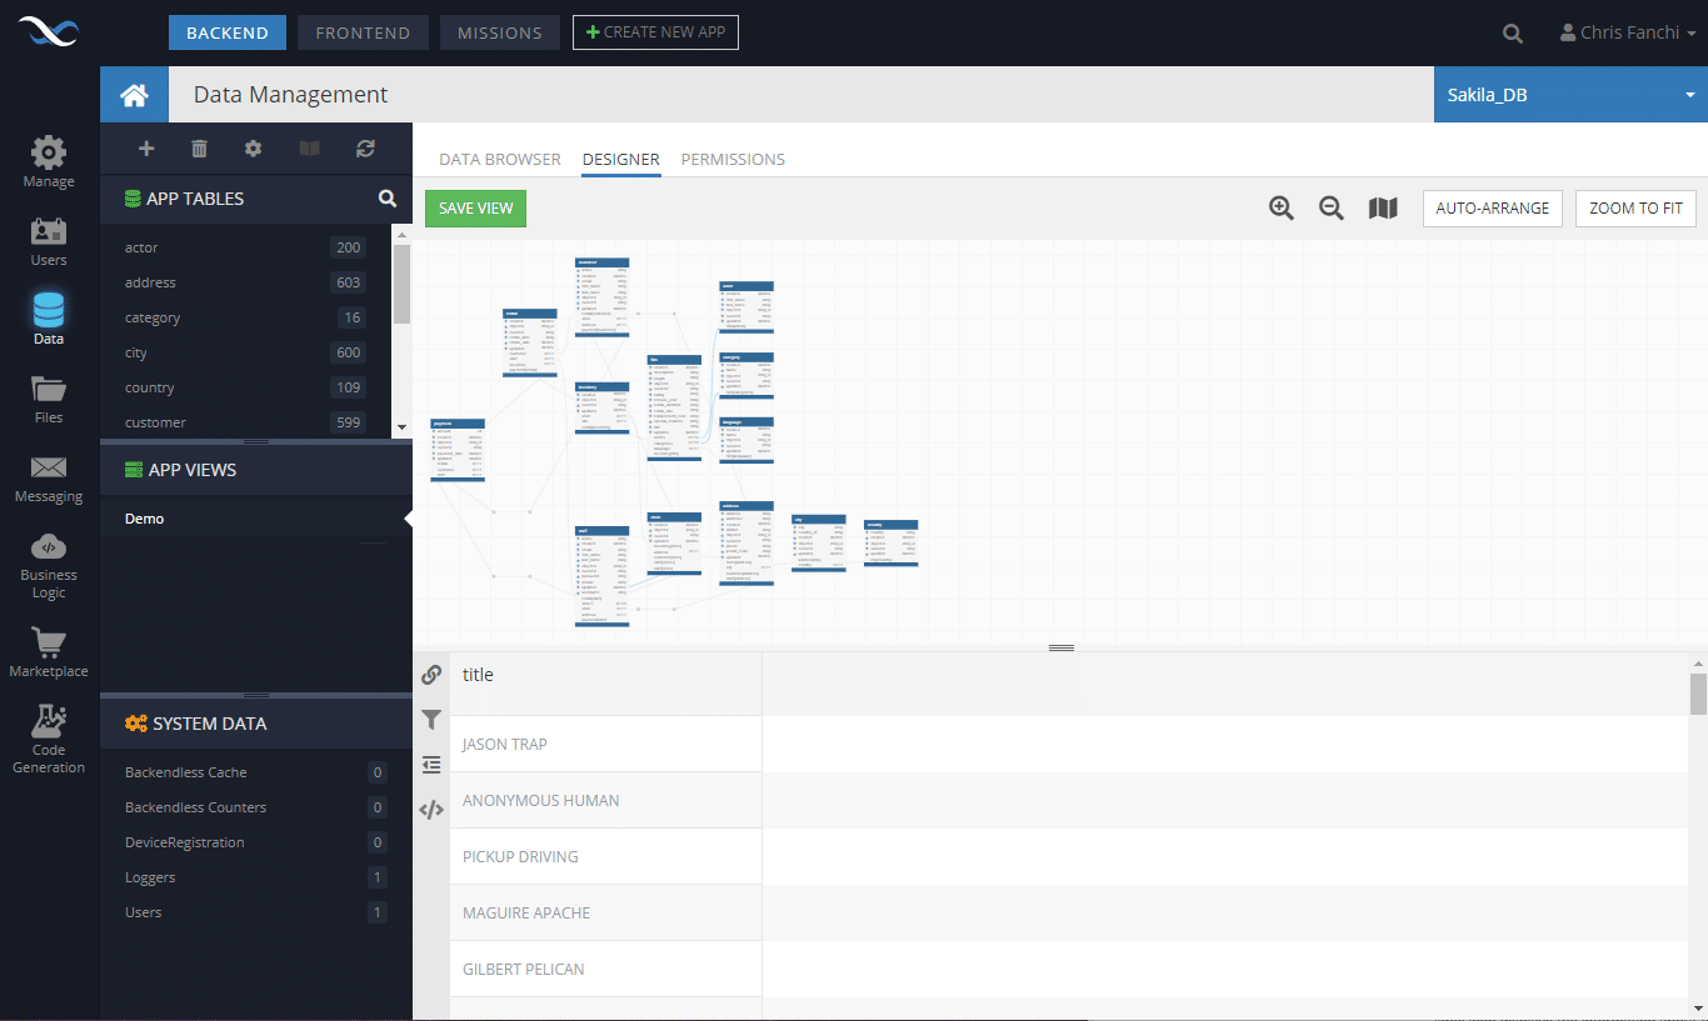
When a column is selected, the view automatically shows data for the selected column. The first column you select becomes the “root” column for the view. This means that any and all related tables in its tree (both children and the parent) will be used as the “context” of the view.
Once the context or “scope” of the view is established by identifying the root table, you can select the columns from any of the related tables.
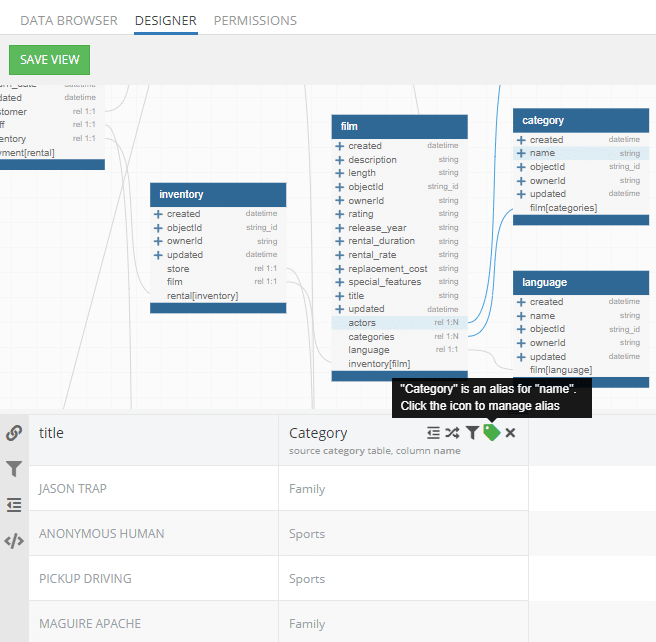
Column Alias
Columns added to a view can be renamed using the aliasing feature. To create an alias, click the “label” icon. When an alias is assigned, the icon becomes green, otherwise, it is gray.
In our example, we want to display the column called name from the related category table. Of course, having a column called name right next to a column called title could be very confusing, so we’ll rename name to Category.
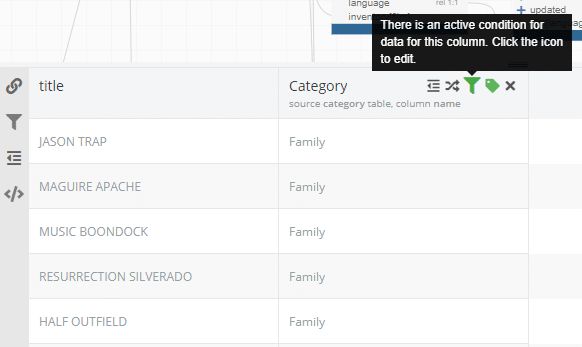
Column Conditions
Every column added to a view may have its own retrieval condition. A condition can be set for each individual column. To configure and manage column condition, click the “filter” icon in the column. When a condition is set, the filter icon is green, otherwise it is gray.
Grouping Conditional Columns
If you have multiple columns with conditions (filters), you can specify in the view how to group those columns. Grouping determines whether the view should treat each condition as an AND or OR when selecting and organizing the data.
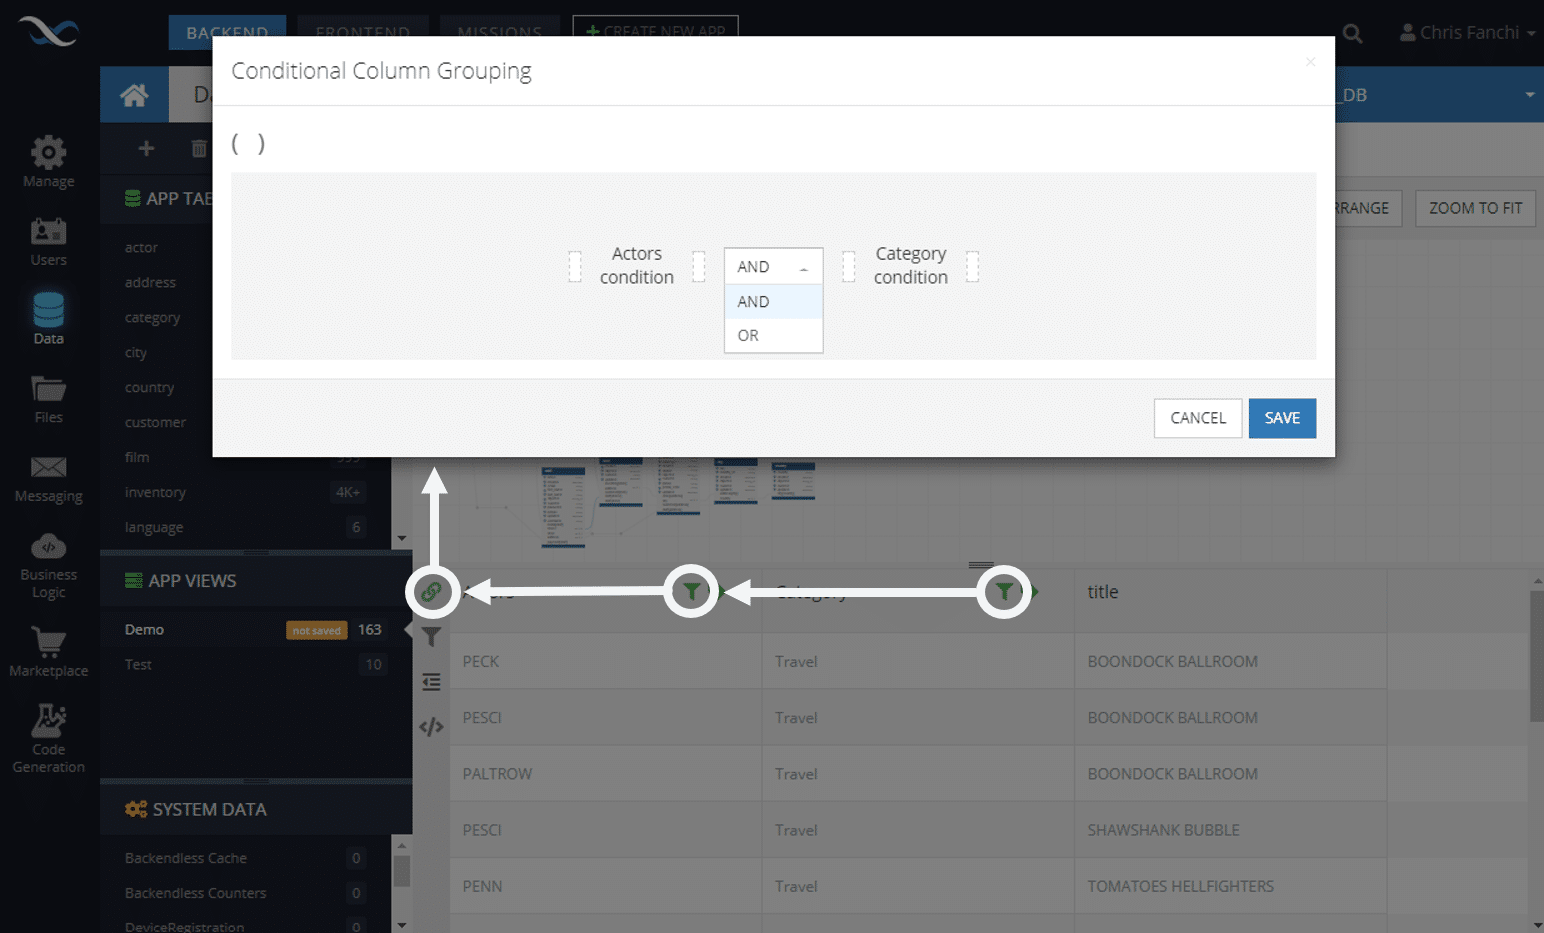
Sequencing Column Conditions
Individual column conditions are sequenced together with the AND operator. You can change the sequencing and grouping using the Configure conditional column grouping interface.
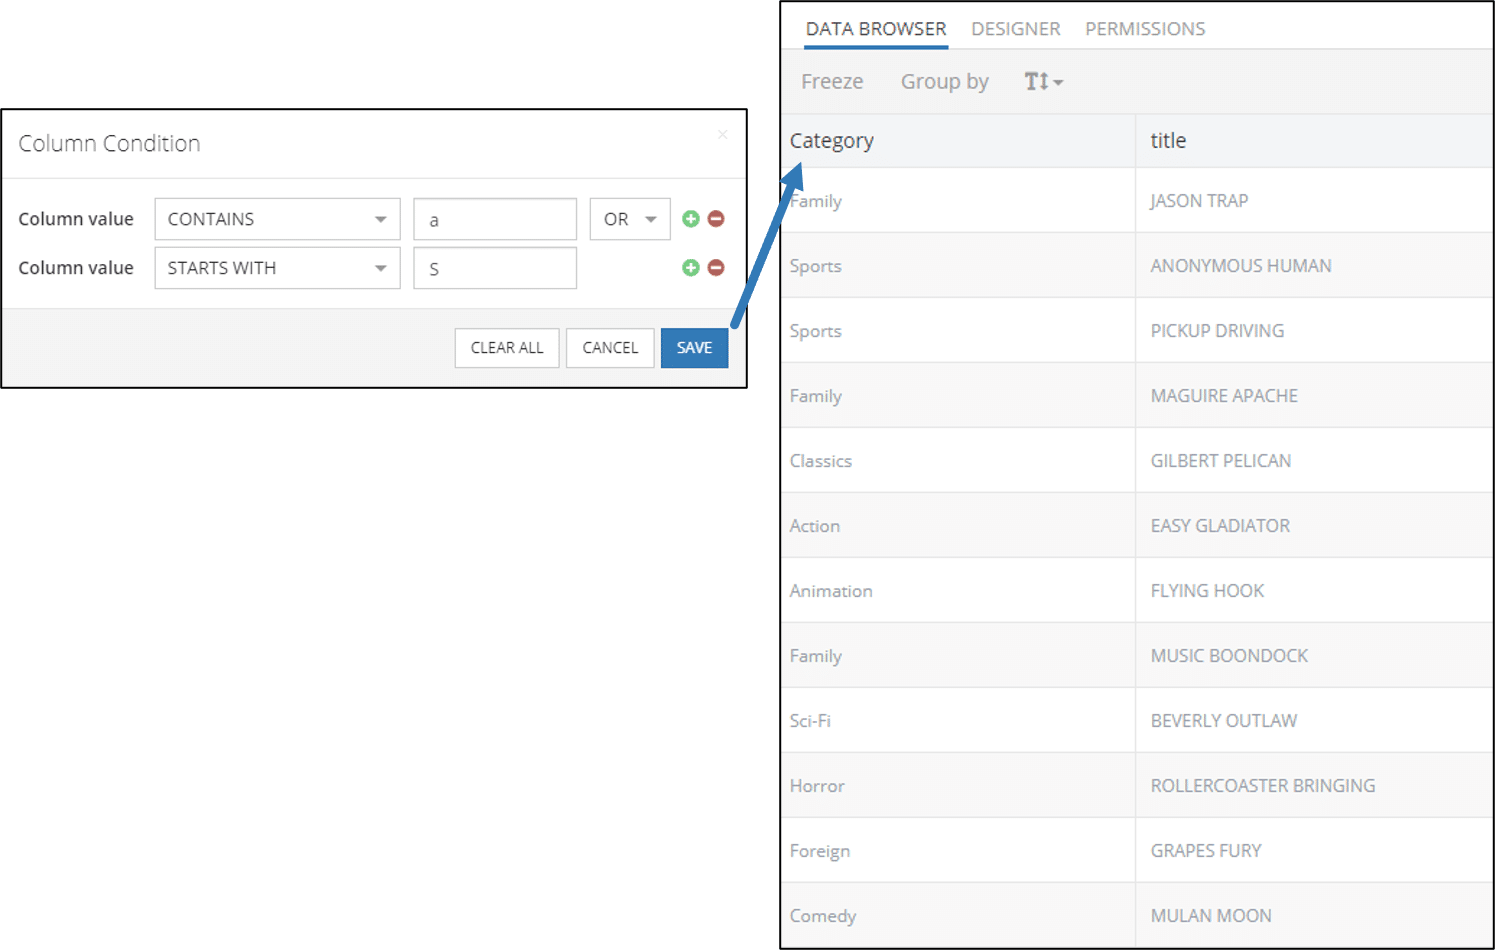
Available column conditions include common SQL search functions. Unlike filtering your data in the Table view, in a view you don’t need to know any SQL syntax to get the results you seek.
Column Transformation
Values for the columns added to a view can be “transformed” using functions. To configure a transformation, click the “double arrow” icon.
![]()
When a transformation is configured, the icon changes to green, otherwise it is gray. Functions available for transformations vary depending on the type of data of the column. Below you can see the functions available for a STRING type column.
![]()
And a DATETIME type column. (As you can see, there are many options for this column type.)
![]()
Aggregated Column Values
Any column added to your view can be aggregated.
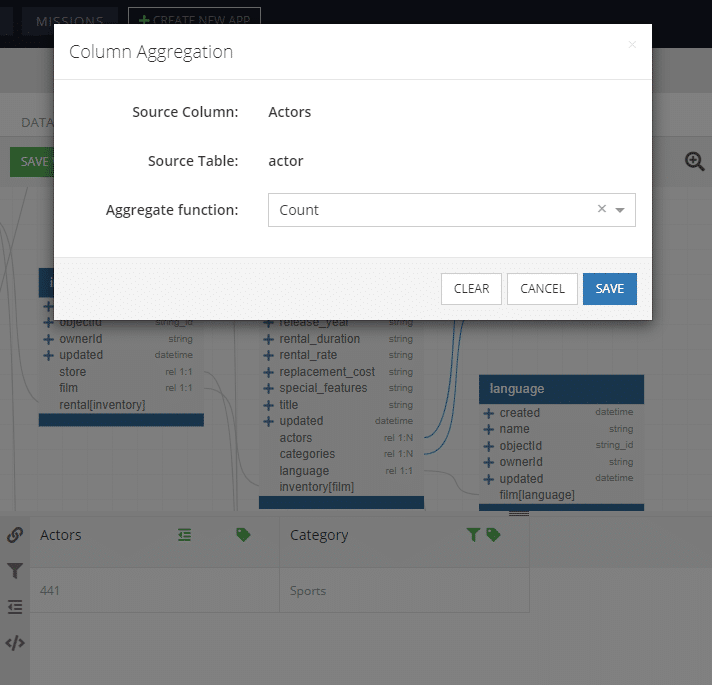
Let’s say we want to know how many actors are listed in the category Sports. We simply include those two columns in our view and a few clicks later:
Grouping of Aggregated Values
If there is at least one column with an aggregation function, the “aggregated values grouping” icon will be enabled (it’s not required to be used). Clicking the icon opens up the “Column Aggregation” popup.
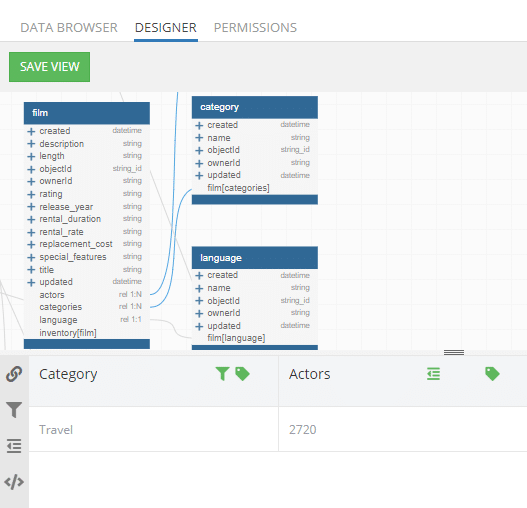
Let’s take our previous example. Now we want to see how many actors there are in every category that includes the letter a.
First, we change the conditions on the Category column. As you can see, all of the categories found are bunched together.
Now we need to click the grouping icon on the left-hand side. This will open the Column Aggregation popup.
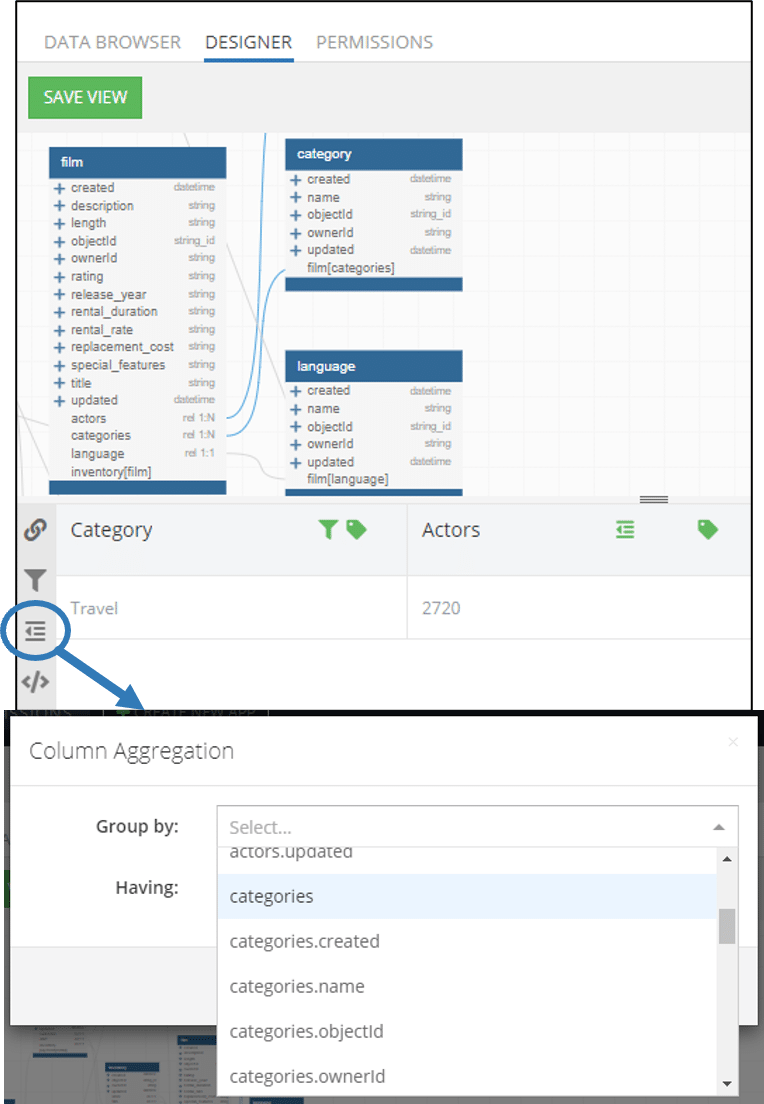
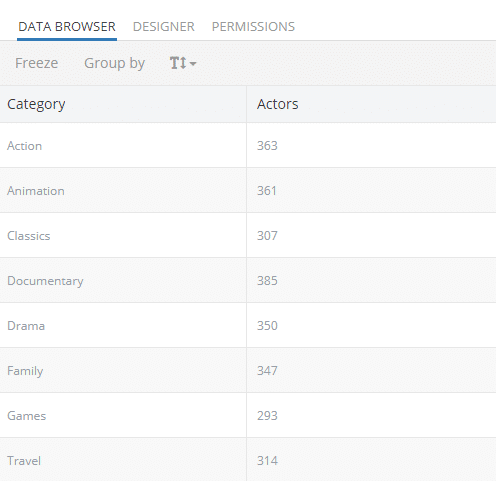
Grouping can be done by any column. For our example, we will select categories.name to group by the category name. The result of the grouping will look something like this:
Master View Condition
In addition to the individual column conditions, a view may have a single (Master) condition which applies to the entire data set.
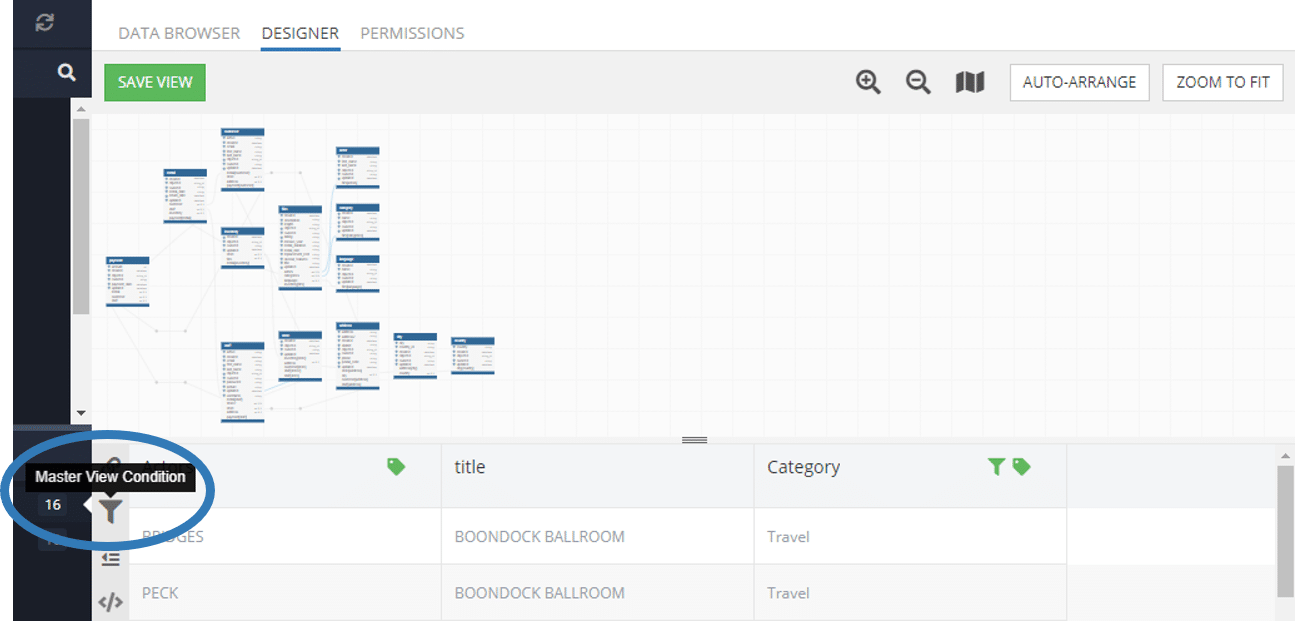
In Backendless Console, you will see the following description of the Master View Condition:
The central context of the view is the table where the first column comes from. The condition can reference any column from any of the related tables.
What this means is that the Master condition will apply to the all tables in the view; you cannot filter the view based on an unrelated table using this condition.
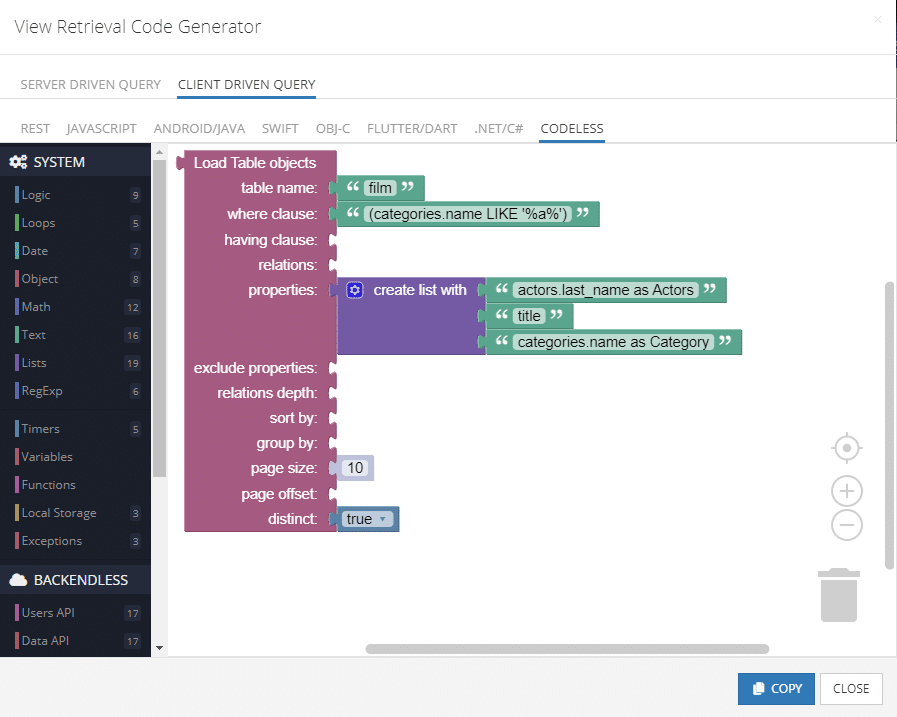
Code Generator
Clicking the Generate query code icon </> opens up a popup with the code that can be used to retrieve the query. The popup contains two primary tabs:
Server-driven Query– code to fetch view data where the query is executed on the serverClient-driven Query– code (mainlyDataQueryBuilder API) which can be executed on the client-side to retrieve the view data
The code can be generated for any of the frontend and backend languages that Backendless supports, including Codeless:
To learn more about the capabilities of Backendless Views, check out our Deep Dive series.
- Part 1 – How To Create A Database View
- Part 2 – How To Transform View Values
- Part 3 – How To Aggregate View Values
- Part 4 – How To Filter/Add Conditions To View Data
Views are a convenient way to display your data in a way that is easily readable for a human. We can’t wait to see the awesome things that you build with this new feature!
Thanks for reading and Happy Codeless Coding!
Awesome! Backendless keeps getting better and better. I can finally get the data I know I want without the trial and error of structuring a query. Great for a designer like me who knows only enough code to be dangerous! Keep up the great work, all!