How To Aggregate View Values
In this article, we detail how to aggregate data within a view in Backendless Database. This is Part 3 of our deep dive into the Views feature in Backendless.
Follow the links below to read the other parts of this series.
- Part 1 – How To Create A Database View
- Part 2 – How To Transform View Values
- Part 4 – How To Filter/Add Conditions To View Data
Aggregation is a function that is applied to a column in a view. Aggregate functions like COUNT, MAX, MIN and AVERAGE can be automatically calculated on any column within the view. These functions will automatically update as the underlying data updates.
Note that all views use the same underlying data. If the data is modified in the database, it will be updated in all views that utilize that data. Like transformations, aggregations do not modify the underlying data; they simply change which data is returned from the database.
For this article series, we’re going to use an example database of fictitious movies. We have a table for films with a variety of relations such as category, actors, actresses, and language.
You can read our overview of views here. You can also watch our full Views Playlist here.
Aggregated Column Values
Any column added to your view can be aggregated.
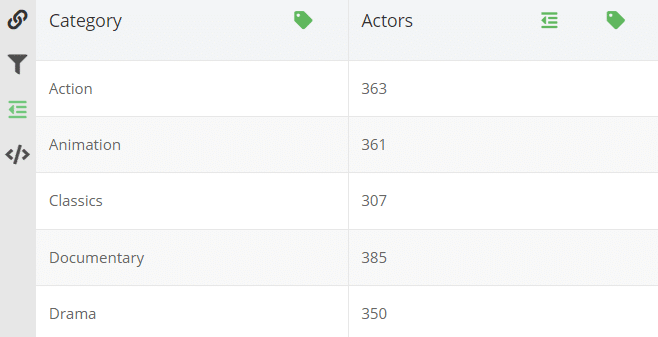
Let’s say we want to know how many actors are listed in each film category. First, we create a view with the category name column and actor last_name column.
![]()
We can then click the “multi-line” aggregation icon (above) to open the column aggregation popup for the actor name column:
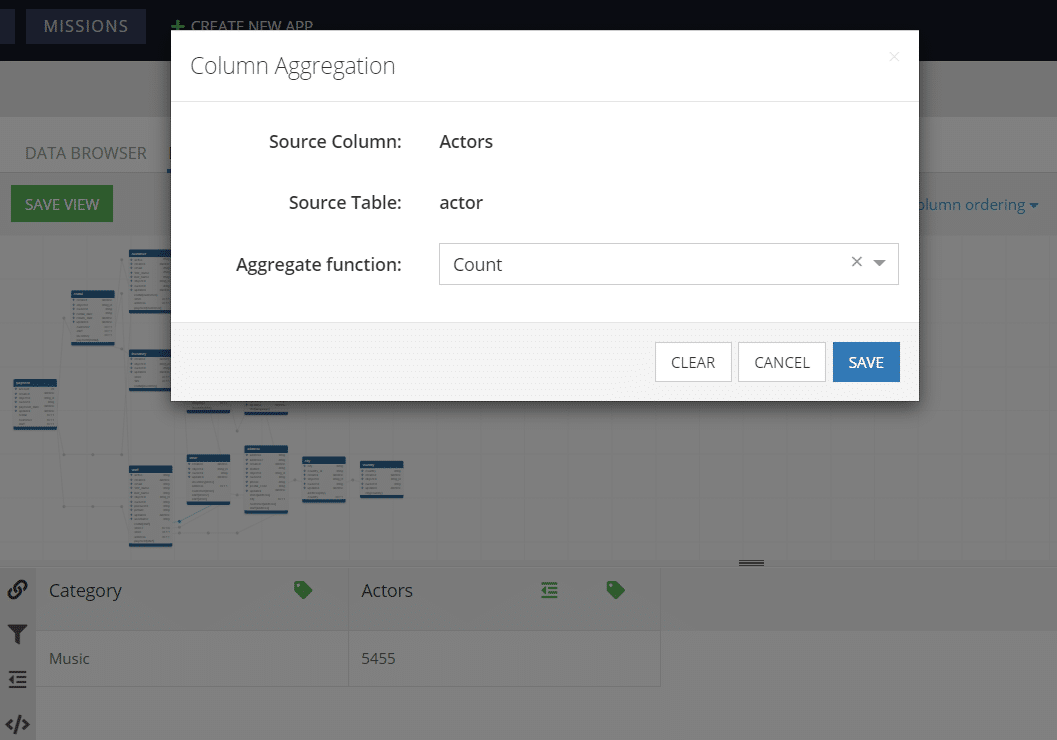
Of course, the result we see is that all categories are grouped together, telling us only the total number of actors. If we want to see the breakdown by category, we will need add grouping.
Grouping of Aggregated Values
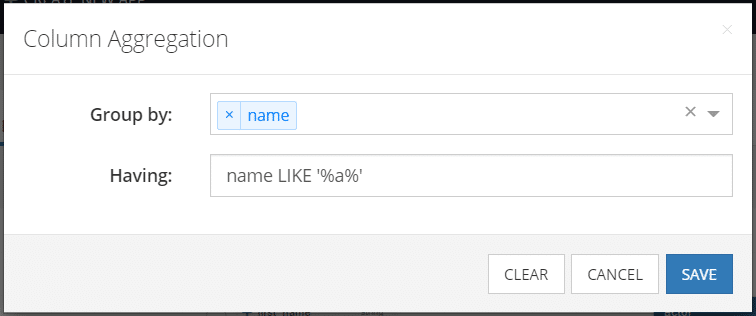
If there is at least one column with an aggregation function, the “aggregated values grouping” icon will be enabled (it’s not required to be used). Clicking the icon opens up the “Column Aggregation” popup.
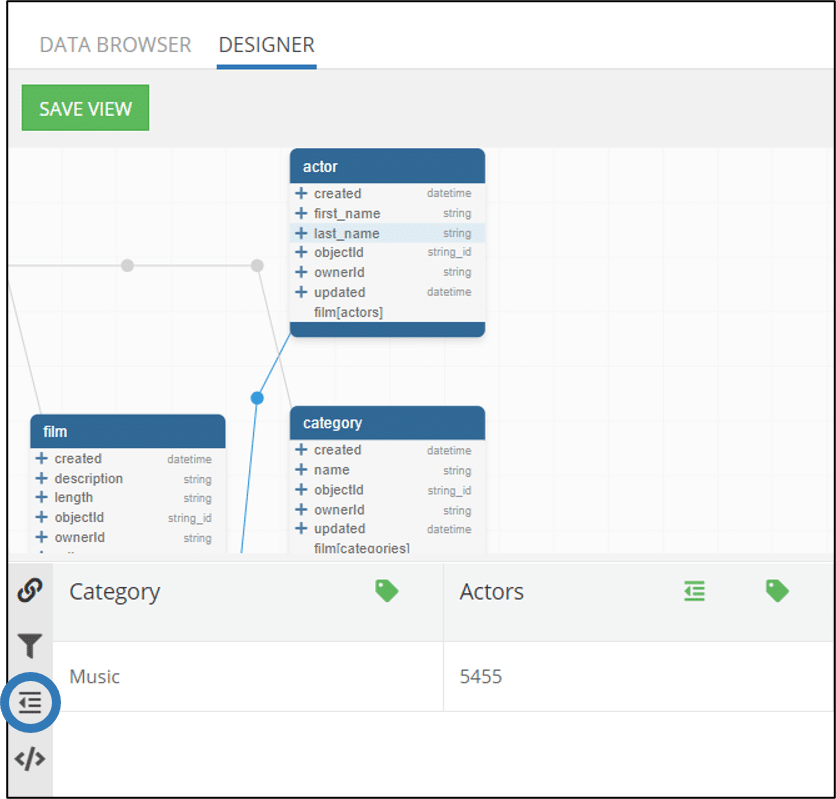
Why did we put the grouping icon on the left side rather than attaching it to each column? This is because each column can have its own aggregate function, while a single grouping function applies to the entire view.
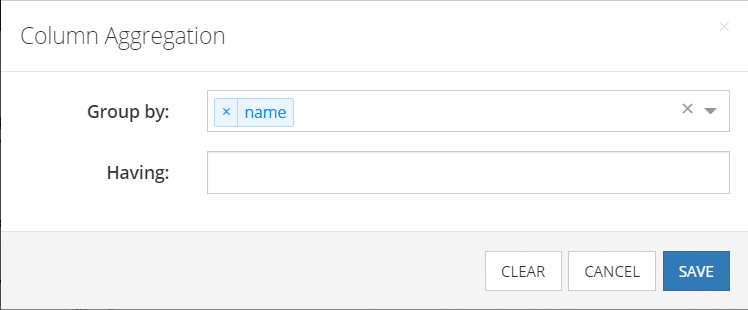
Grouping can be done by any column(s) included in the scope of the view. For our example, we will select name to group by the category name.
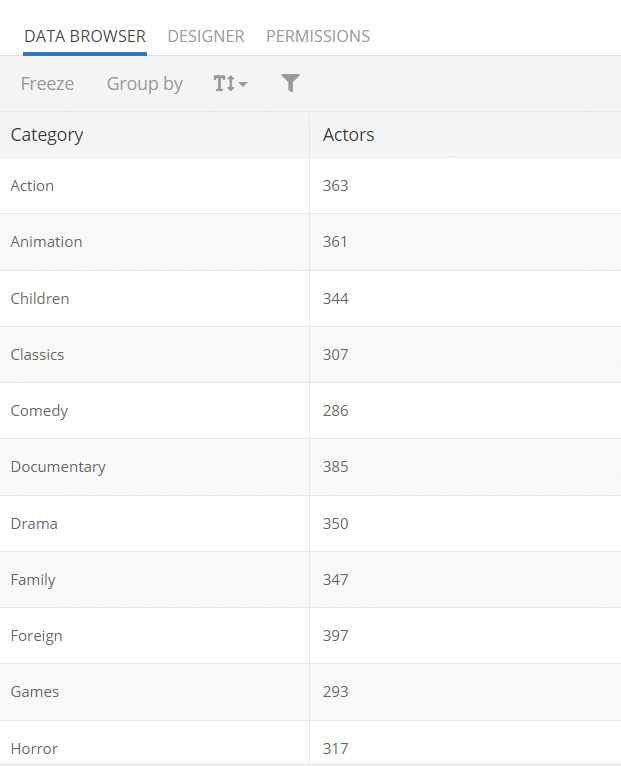
The result of the grouping will look something like this:
You will notice that there is a second option in the grouping popup labeled HAVING. This text box allows you to enter an SQL-style filter to display only certain items from the group.
Let’s look at an example. Say we want to only look at the categories including the letter a. To do this, we will add the HAVING value of:
name LIKE '%a%'
In this filter, the % is a wildcard that tells the system to look for the letter a regardless of what character is on either side of it.
Comparing the resulting table to the non-filtered table, we see that items without the letter a in them are excluded, such as Children and Comedy.
Next in our views series, we will take a look at Filtered/Conditional Data.
Thanks for reading and Happy Codeless Coding!