Visualizing data is a valuable way to glean insights into your data quickly and without the need to hire a data scientist. Backendless Visualizations also make it super easy to share those insights with others.
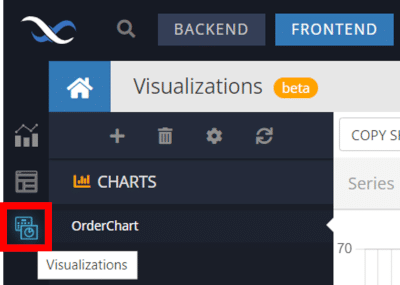
Visualizations are a new feature released as part the Backendless version 7.0. To access Visualizations, navigate to the Frontend and select the Visualizations icon.
In this article, we’ll take a deep dive into this feature and the visualization types available in the initial release. Let’s get started.
What are Visualizations?
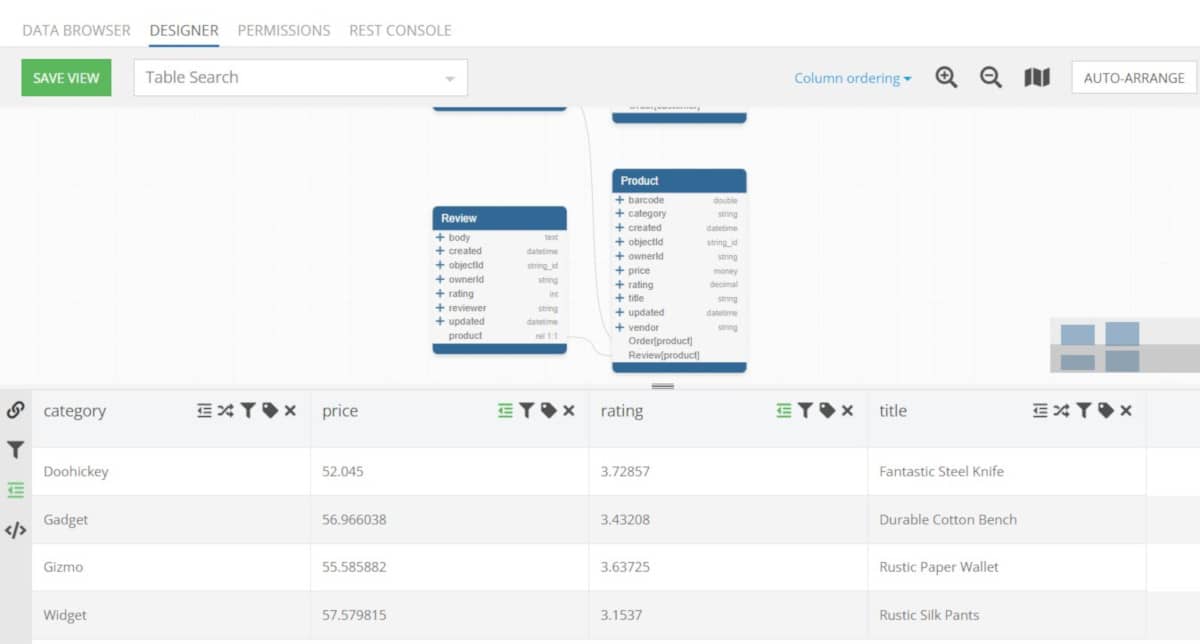
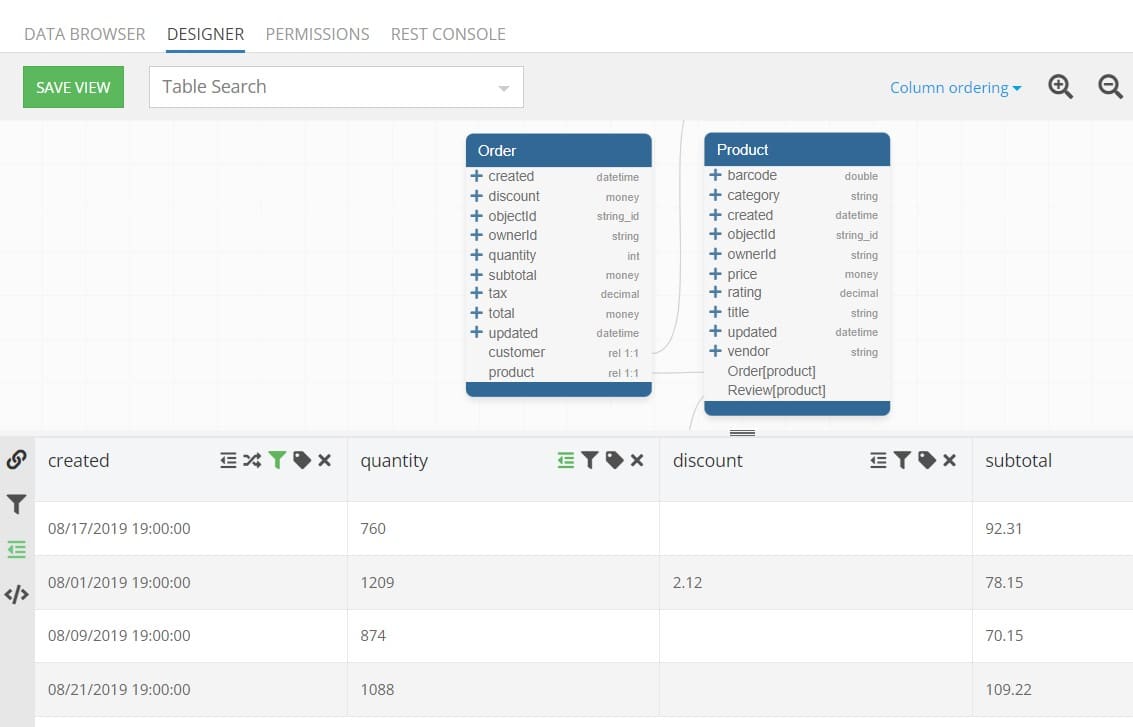
Visualizations in Backendless are an easy way to visualize data stored in your Backendless Database. Many allow you to simply use data tables to build your visualizations, while some allow or require you to use Views that you’ve created.
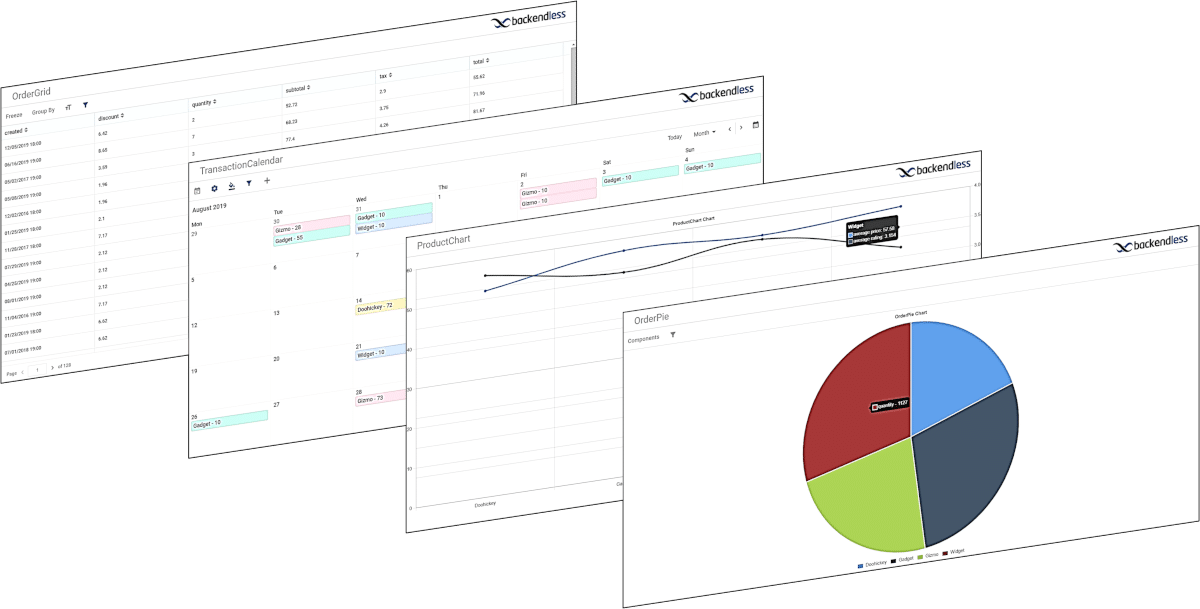
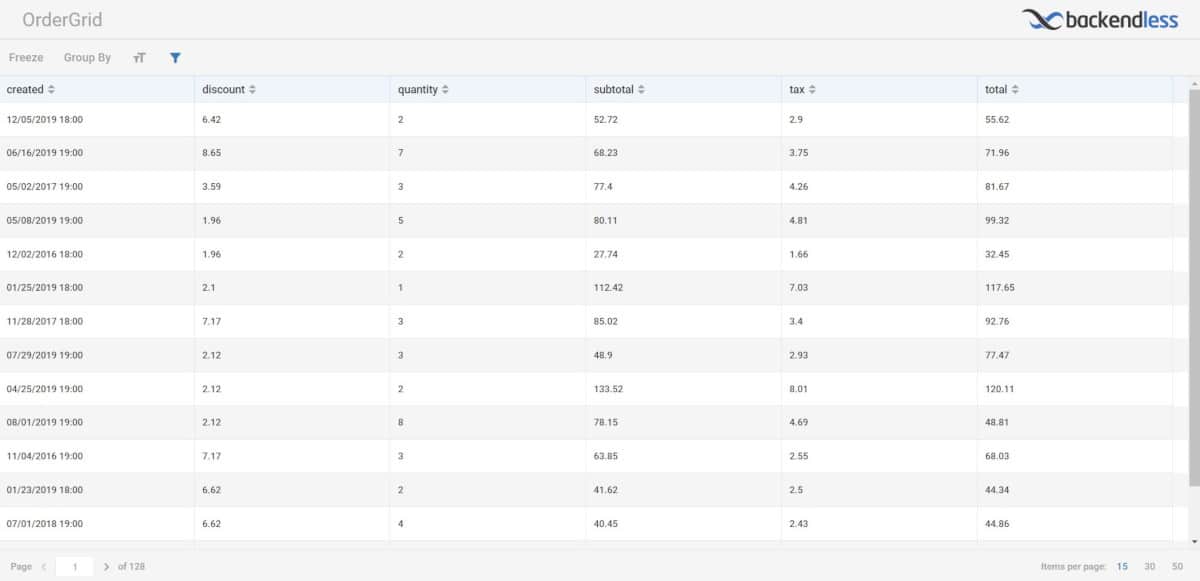
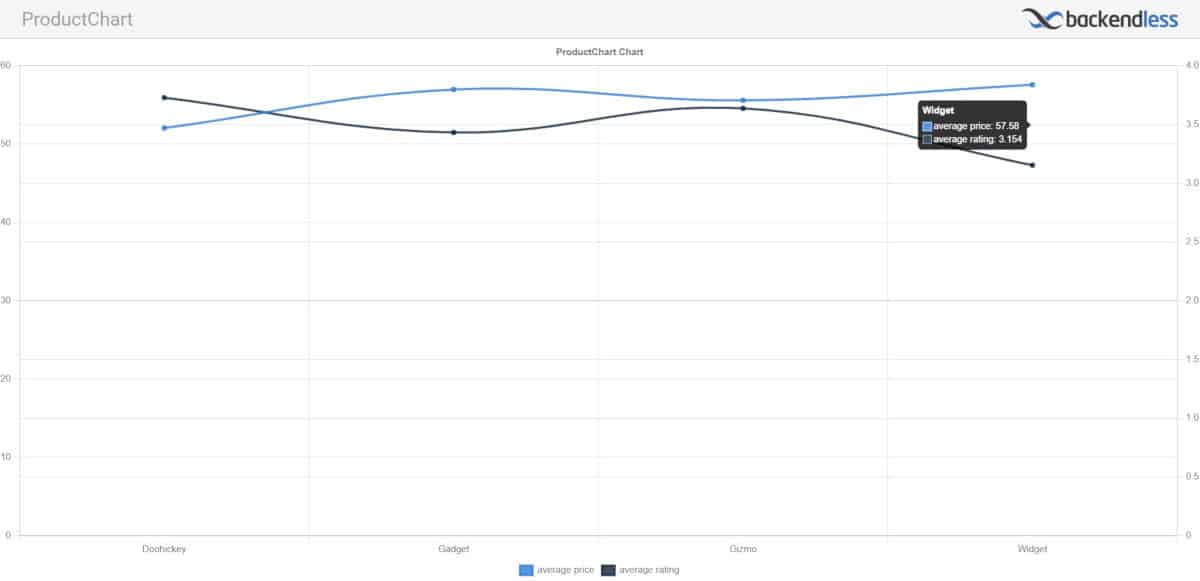
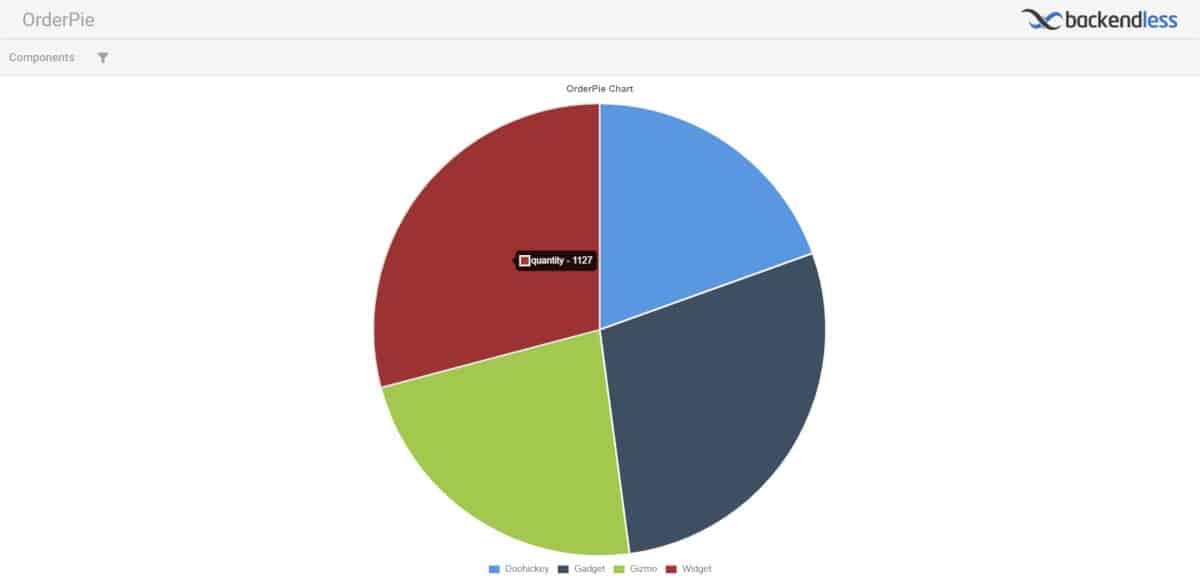
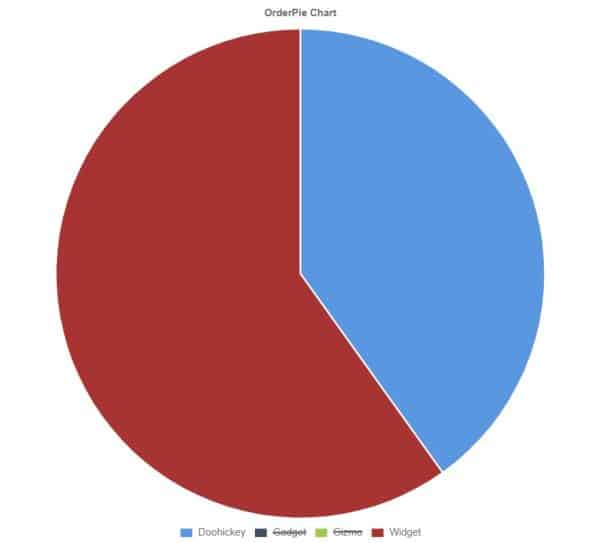
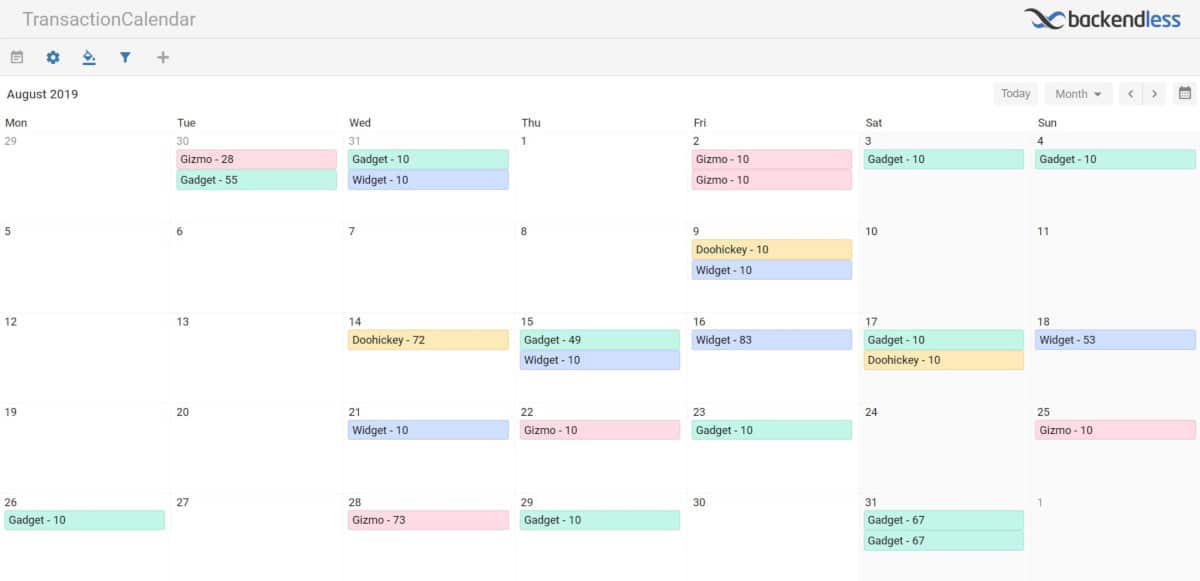
Visualizations come in the form of charts, spreadsheet-style data grids, and calendars. They allow you to display data in a way that is easy to understand visually. You can also include tools to allow the viewer to manipulate the visualization themselves to dig deeper into the data you share.
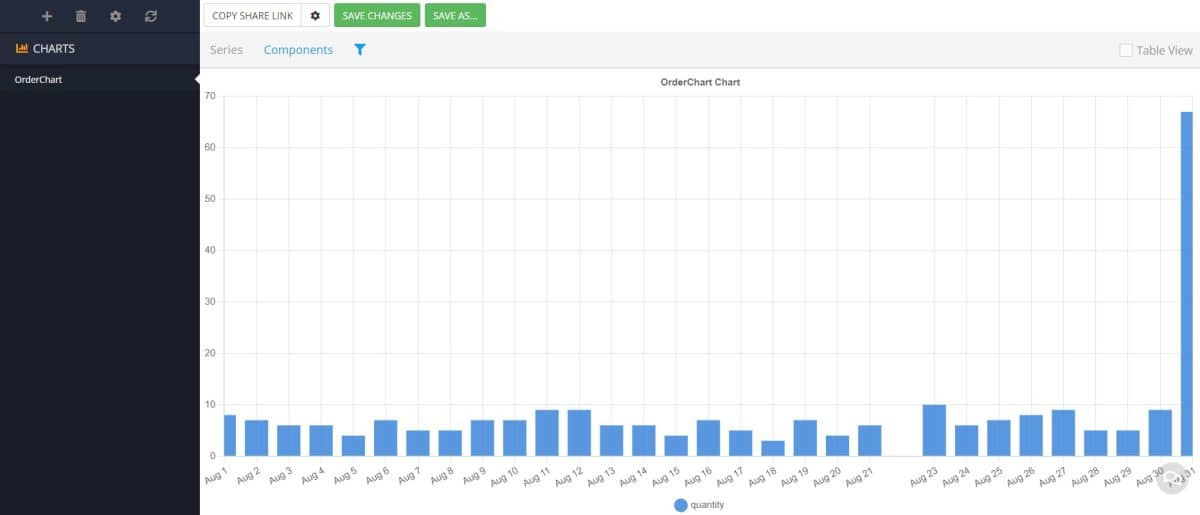
Once you create a visualization, you can easily make adjustments by modifying the choice of data source, such as choosing a different table or column. You can also “Save As” a Visualization to save a new copy, allowing you to preserve the original visualization while creating spin-offs for separate data groups, date ranges, categories, etc.
Sharing Visualizations
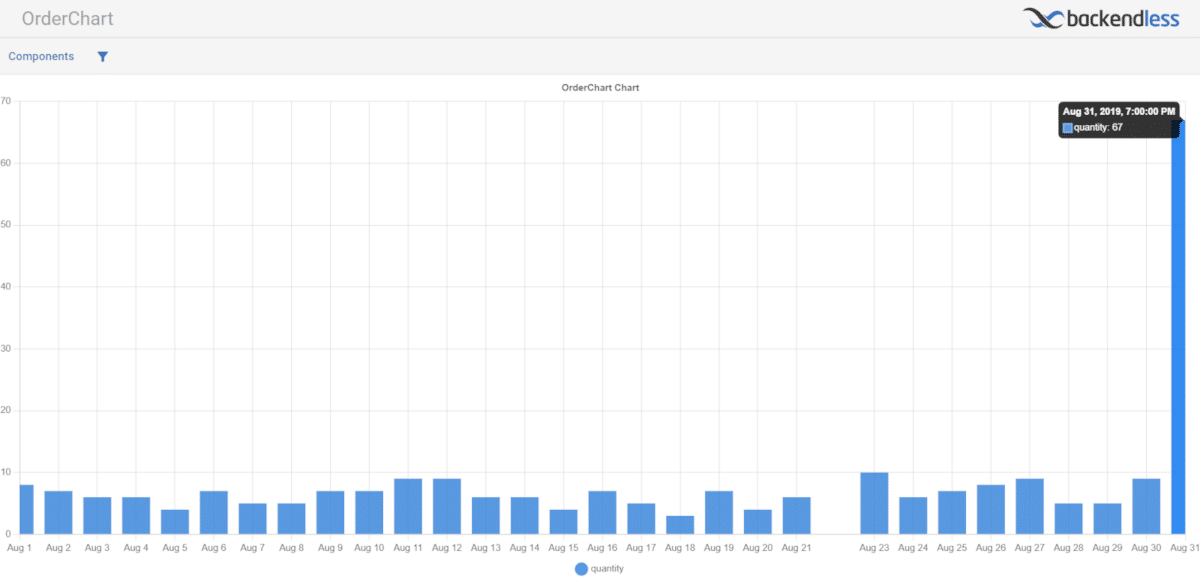
Your visualizations can be shared with others, even if you don’t have a published app. Visualizations are a quick and easy way to share data insights without using UI Builder to build a complete page or app.
To share a visualization, simply click the Copy Share Link button to copy a link to a live Visualization page.
Before you share, however, you might want to setup some restrictions to ensure your data doesn’t fall into the wrong hands. The Visualization settings, next to the `Copy Share Link` button, give you extra control.
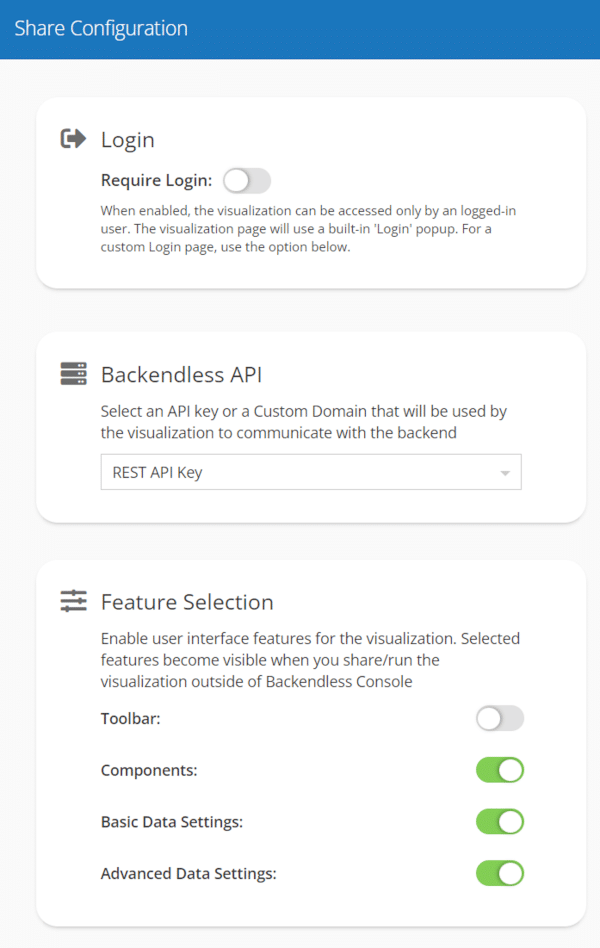
With “Share Configuration”, you can adjust what a person sees when using the share link. First, you can enable a login requirement, meaning that the viewer must login using credentials stored in your app’s Users table in order to view the data. Additional configuration options for the login page are coming soon.
Second, you can choose which API key the Visualization will use to access your database. If you are wanting to track how many users access your Visualization, you may want to create a custom key to enable you to easily identify how much traffic your Visualizations are generating.
Additionally, API keys are mapped to Security Roles in Backendless. So if your Visualization reveals sensitive information, you can ensure that it is only accessible by those with the proper permissions by choosing a restricted API key.
Third, you can adjust the features available on the shared Visualization’s user interface. You can toggle on and off settings such as the Toolbar, Components, Basic Data Settings, and Advanced Data Settings options. Settings available will vary depending on the Visualization type.
Further customization will become available in future updates.
Visualizations in UI Builder
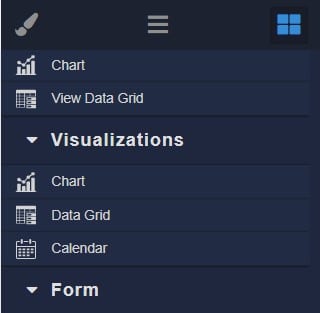
Visualizations that you create can easily be added as components to your UI Builder app as well. A Visualizations section has been added to the UI Builder toolkit, and all of your created Visualizations automatically become available in UI Builder for that app.



Good stuff! Visualizations are clearly useful for team members & app owners… but could they also be used for individual app users to see visualizations for their particular small sub-data set? For example, say your app is a social media-type application where people post things. Would we want to use visualizations to show a user how many posts they’ve made over time?
Yes, absolutely! The Visualizations you build can be included in UI Builder apps and use variables/user data to visualize data dynamically based on user inputs or logic you build into the page/API call. So they can definitely be used to enable app users to visualize their own data in your app.
Any documentation about how to “visualize data dynamically based on user inputs or logic you build into the page/API call”?