How to Debug Backendless Timers Locally on a Developer Machine
In a previous post, we introduced Backendless CodeRunner – a debugging utility for custom business logic. Now that you can run your timer code locally using CodeRunner, we’d like to show how you can attach your IDE to the CodeRunner process and debug the code.
The CodeRunner is configured to listen for remote debugging connections on port 5005. It is sufficient to create a debugging configuration in your IDE. For example, in IntelliJ IDEA, the configuration would look like this:

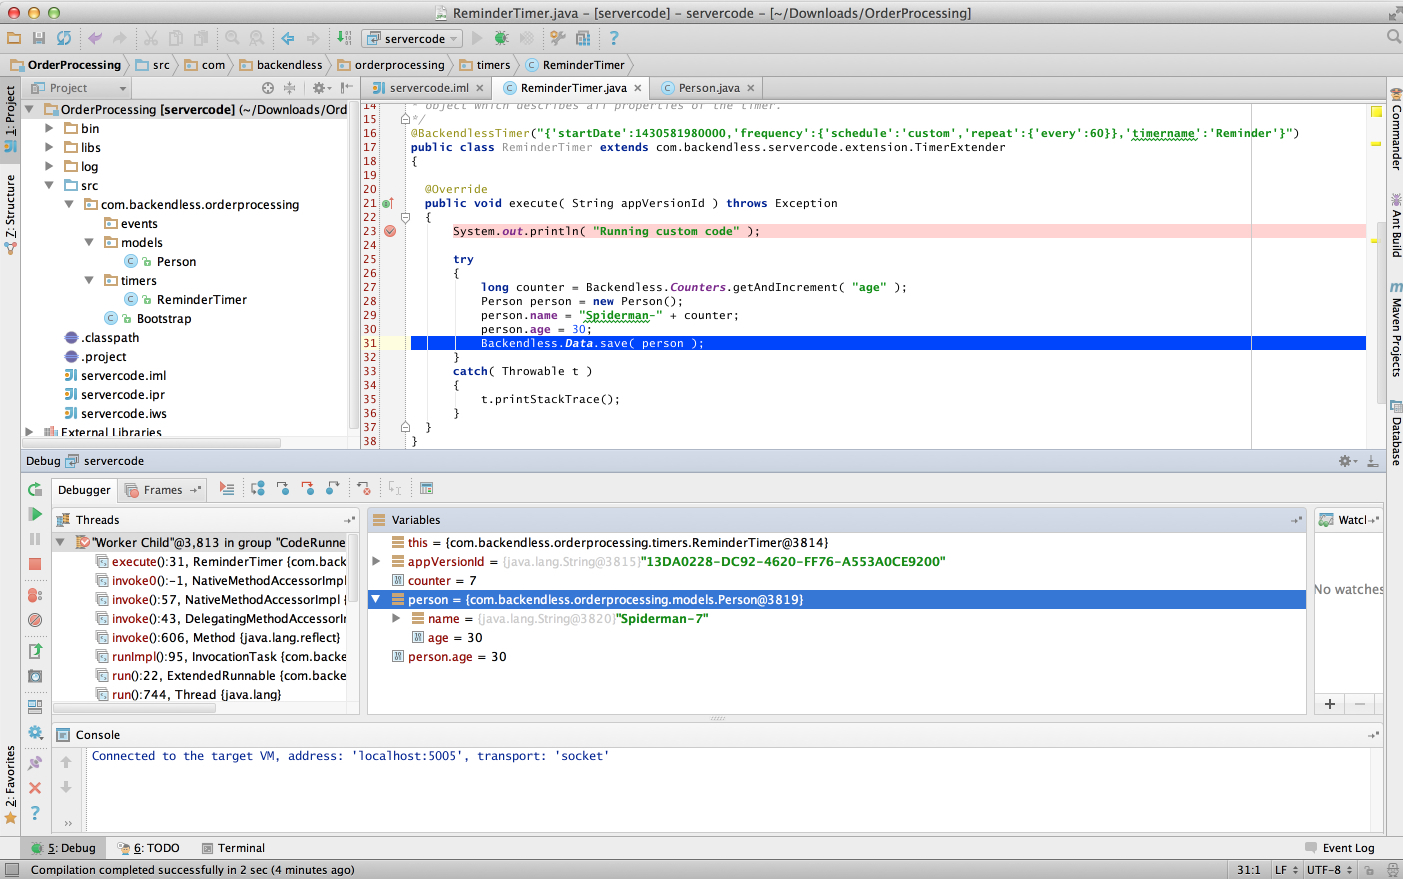
Once you run the debugger, it automatically attaches to the CodeRunner process. When you set a breakpoint, it lets you step through the code and inspect all the variables.

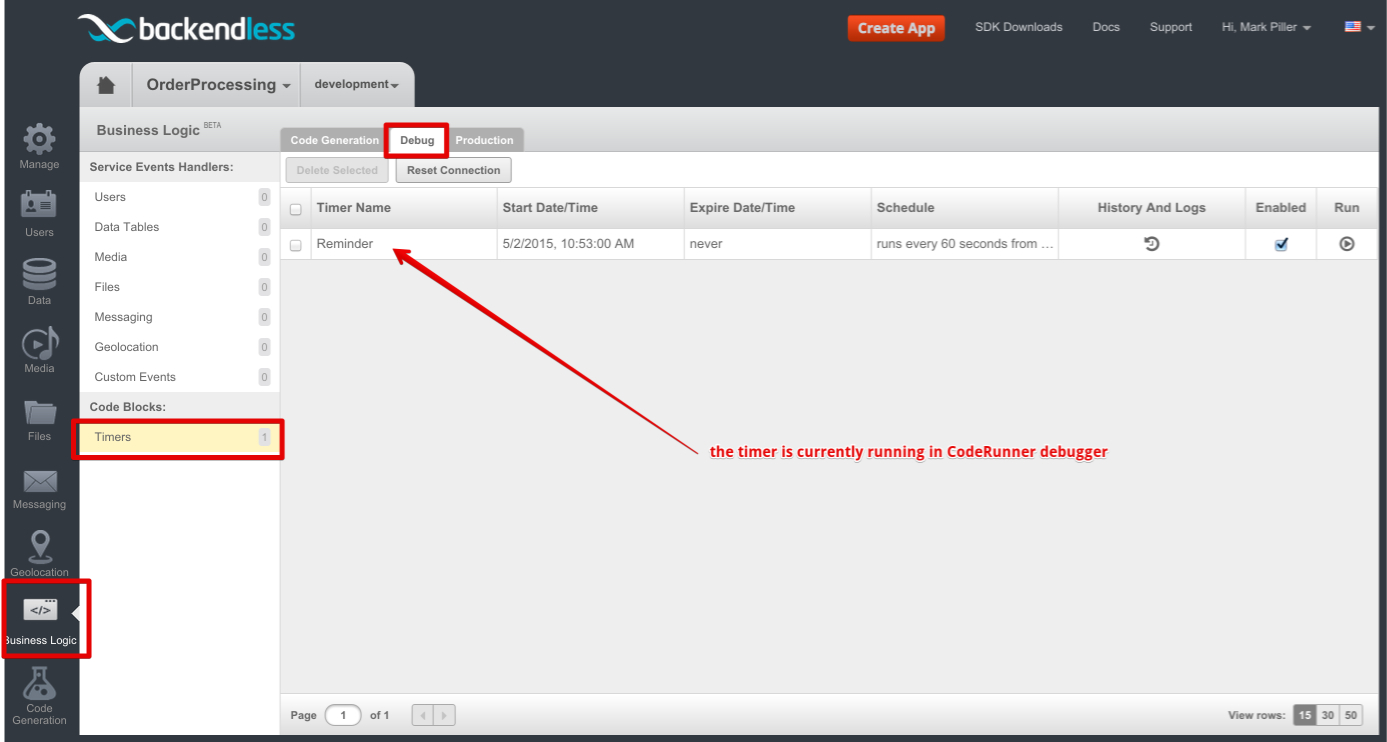
When CodeRunner runs, it automatically registers your timer classes in your Backendless backend. As a result, the scheduling of the timer events is handled in the cloud and your timer executions are controlled by the Backendless “mothership”. While CodeRunner is running, you can inspect your local debugging session using Backendless Console. To do this:
- Click the Business Logic (Cloud Code) icon.
- Click the Timers menu in the list on the left.
- Click the Debug tab. If CodeRunner debugger is running, Console will display the debugging session:

Notice the Run column. It lets you execute a timer event on-demand (out of order). This is a very convenient way to force a timer to run especially when you do not want to wait for the next timer event and need to debug your code.
Enjoy!
