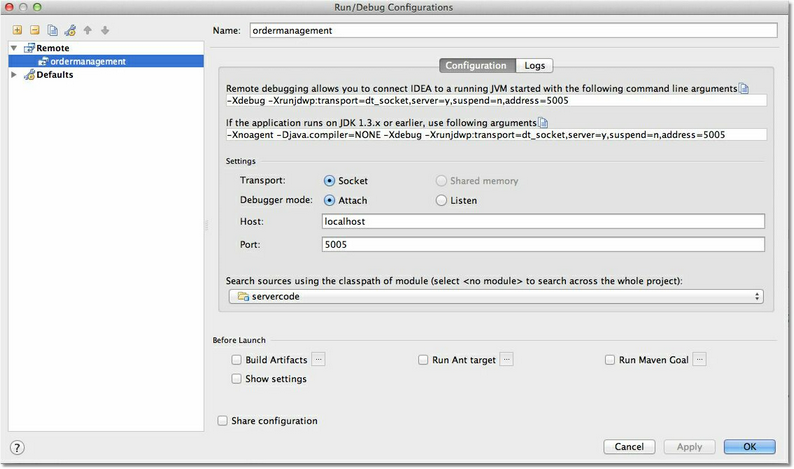
Now that you confirmed that the custom code is plugged into the API invocation chain, it is important to establish a connection between the coderunner process and the IDE debugger. CodeRunner is automatically configured to accept remote debugging connections on port 5005. To connect to the process, use the remote debugging facility in the IDE. For example, in IntelliJ IDEA, select "Run" from the main menu and then select "Edit Configurations". Click the "plus" icon to add a new configuration. Select "Remote" from the list and enter "ordermanagement" into the name field as shown below:
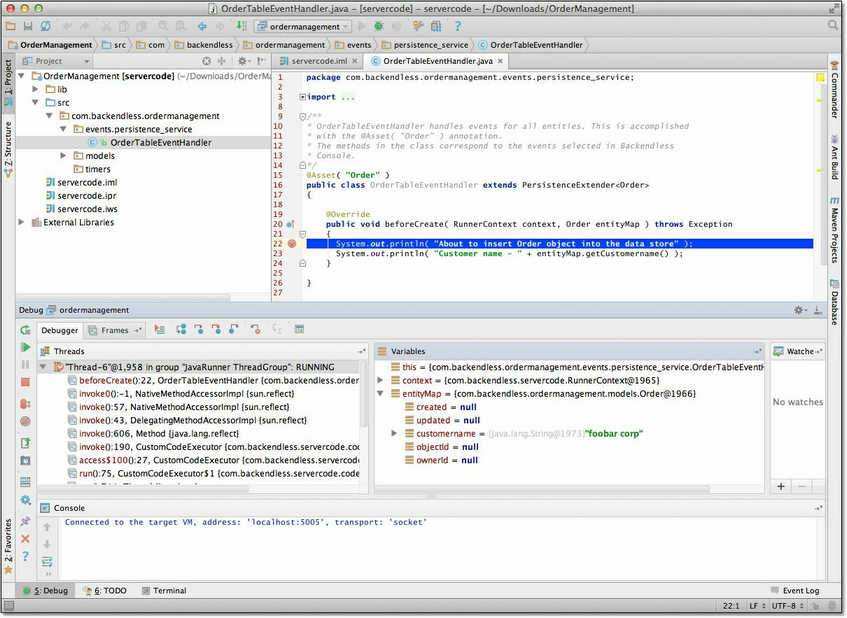
Click OK and launch the debugger. Once the debugger is attached to the CodeRunner process, you can establish breakpoints in the code and re-run the client application. Usually debugging takes more time than the duration of the timeout on the client-side. You should expect that the client application (or even the curl request) will receive a timeout, but you should still be able to continue the debugging of your custom code. s
 s
s
