Attaching IDE Debugger
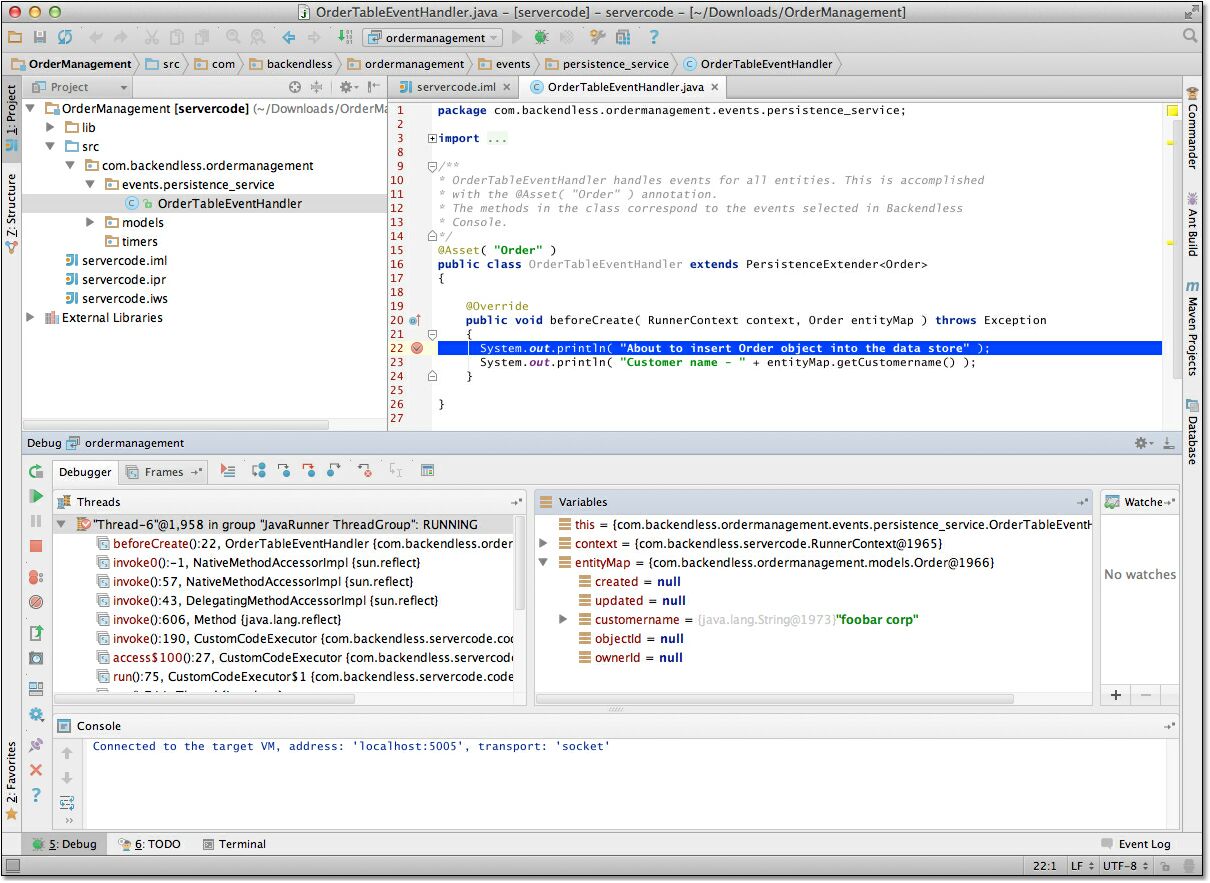
CodeRunner™ is automatically configured to accept remote debugging connections on port 5005. To connect an IDE debugger to the CodeRunner™ process, use the remote debugging facility in the IDE. For example, in IntelliJ IDEA, select Run from the main menu and then select Edit Configurations. Click the "plus" icon to add a new configuration. Select Remote from the list and enter "ordermanagement" into the name field as shown below:
Click OK and launch the debugger. Usually debugging takes more time than the duration of the timeout on the client-side. You should expect that the client application (or even the curl request) will receive a timeout, but you should still be able to continue the debugging of your custom code.
 s
s
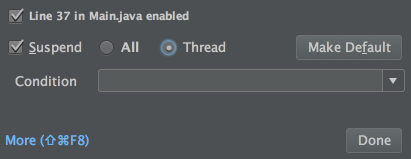
If you need to set a breakpoint in the code, it is important to configure them in a way that does not block the entire process. In IntelliJ IDEA, this is accomplished as described below:
- Set a breakpoint on a line of code.
- Right click the breakpoint to open the context dialog.
- Chose Thread for the Suspend option as shown in the screenshot:
Video overview of the local debugging functionality: